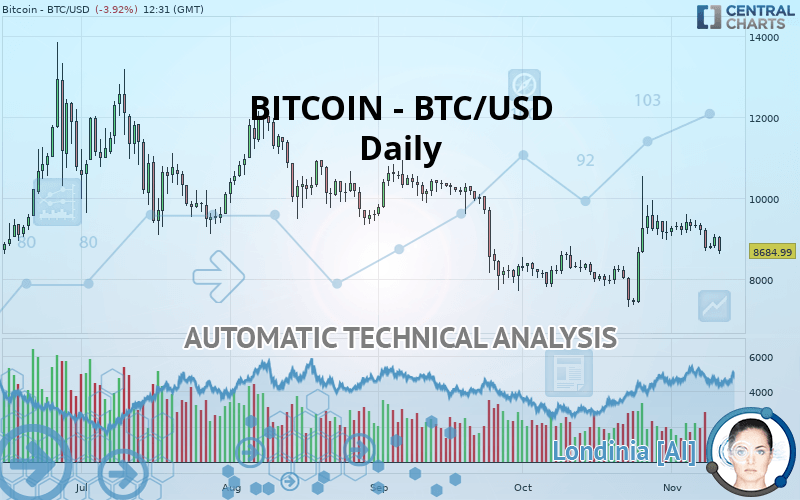
BITCOIN - BTC/USD - Daily - Technical analysis published on 11/11/2019 (GMT)
- Who voted?
- 152
- 0
Click here for a new analysis!
- Timeframe : Daily
- - Analysis generated on
- Status : TARGET REACHED

Summary of the analysis

Additional analysis
Quotes
BITCOIN - BTC/USD rating 8,684.99 USD. On the day, this instrument lost -3.92% and was between 8,616.20 USD and 9,068.20 USD. This implies that the price is at +0.80% from its lowest and at -4.23% from its highest.A bearish opening was detected by the Central Gaps scanner. Sellers are trying to impose a bearish trend in the very short term.
Bearish opening
Type : Bearish
Timeframe : Openning
So that you have an overall view of the price change, here is a table showing the variations over several periods:
Technical
Technical analysis of this Daily chart of BITCOIN - BTC/USD indicates that the overall trend is bearish. The signals given by moving averages are 78.57% bearish. This bearish trend could slow down given the neutral signals currently being given by short-term moving averages. The Central Indicators market scanner is currently detecting several bearish signals that could impact this trend:
Bearish price crossover with Moving Average 20
Type : Bearish
Timeframe : Daily
Bearish price crossover with adaptative moving average 20
Type : Bearish
Timeframe : Daily
Bearish price crossover with adaptative moving average 50
Type : Bearish
Timeframe : Daily
The probability of a further decline is low given the direction of the technical indicators.
Caution: the Central Indicators scanner currently detects an excess:
Williams %R indicator is oversold : under -80
Type : Neutral
Timeframe : Daily
Pivot points : price is under support 1
Type : Neutral
Timeframe : Daily
RSI indicator is back under 50
Type : Bearish
Timeframe : Daily
Parabolic SAR indicator bearish reversal
Type : Bearish
Timeframe : Daily
Price is back over the pivot point
Type : Bullish
Timeframe : Daily
Price is back under the pivot point
Type : Bearish
Timeframe : Weekly
Central Patterns, the scanner specializing in chart patterns, did not identify any signals.
The Central Candlesticks scanner which studies Japanese candlesticks did not detect anything.
| S3 | S2 | S1 | Price | R1 | R2 | R3 | |
|---|---|---|---|---|---|---|---|
| ProTrendLines | 5,875.21 | 7,432.72 | 8,220.01 | 8,684.99 | 9,476.52 | 10,594.50 | 11,988.10 |
| Change (%) | -32.35% | -14.42% | -5.35% | - | +9.11% | +21.99% | +38.03% |
| Change | -2,809.78 | -1,252.27 | -464.98 | - | +791.53 | +1,909.51 | +3,303.11 |
| Level | Major | Major | Major | - | Major | Minor | Minor |
Pivot points can also be used to set your price objectives. Here is the price situation in relation to pivot points:
| Pivot points | S3 | S2 | S1 | PP | R1 | R2 | R3 |
|---|---|---|---|---|---|---|---|
| Standard | 8,471.87 | 8,612.43 | 8,825.87 | 8,966.43 | 9,179.87 | 9,320.43 | 9,533.87 |
| Camarilla | 8,941.95 | 8,974.40 | 9,006.85 | 9,039.30 | 9,071.75 | 9,104.20 | 9,136.65 |
| Woodie | 8,508.30 | 8,630.65 | 8,862.30 | 8,984.65 | 9,216.30 | 9,338.65 | 9,570.30 |
| Fibonacci | 8,612.43 | 8,747.66 | 8,831.21 | 8,966.43 | 9,101.66 | 9,185.21 | 9,320.43 |
| Pivot points | S3 | S2 | S1 | PP | R1 | R2 | R3 |
|---|---|---|---|---|---|---|---|
| Standard | 7,537.10 | 8,106.10 | 8,459.05 | 9,028.05 | 9,381.00 | 9,950.00 | 10,302.95 |
| Camarilla | 8,558.46 | 8,642.98 | 8,727.49 | 8,812.00 | 8,896.51 | 8,981.02 | 9,065.54 |
| Woodie | 7,429.08 | 8,052.09 | 8,351.03 | 8,974.04 | 9,272.98 | 9,895.99 | 10,194.93 |
| Fibonacci | 8,106.10 | 8,458.28 | 8,675.87 | 9,028.05 | 9,380.24 | 9,597.82 | 9,950.00 |
| Pivot points | S3 | S2 | S1 | PP | R1 | R2 | R3 |
|---|---|---|---|---|---|---|---|
| Standard | 4,216.82 | 5,757.51 | 7,454.83 | 8,995.52 | 10,692.84 | 12,233.53 | 13,930.86 |
| Camarilla | 8,261.71 | 8,558.53 | 8,855.34 | 9,152.16 | 9,448.98 | 9,745.80 | 10,042.61 |
| Woodie | 4,295.15 | 5,796.67 | 7,533.16 | 9,034.68 | 10,771.17 | 12,272.69 | 14,009.18 |
| Fibonacci | 5,757.51 | 6,994.43 | 7,758.60 | 8,995.52 | 10,232.44 | 10,996.61 | 12,233.53 |
Numerical data
The following is the status of the technical indicators and moving averages at the time of publication of this technical analysis:
| RSI (14): | 46.54 | |
| MACD (12,26,9): | 94.5300 | |
| Directional Movement: | 4.30 | |
| AROON (14): | -100.00 | |
| DEMA (21): | 9,075.26 | |
| Parabolic SAR (0,02-0,02-0,2): | 10,536.20 | |
| Elder Ray (13): | -146.30 | |
| Super Trend (3,10): | 8,032.56 | |
| Zig ZAG (10): | 8,700.00 | |
| VORTEX (21): | 1.0400 | |
| Stochastique (14,3,5): | 15.58 | |
| TEMA (21): | 9,171.41 | |
| Williams %R (14): | -93.02 | |
| Chande Momentum Oscillator (20): | -478.50 | |
| Repulse (5,40,3): | -4.7800 | |
| ROCnROLL: | 2 | |
| TRIX (15,9): | 0.3000 | |
| Courbe Coppock: | 5.18 |
| MA7: | 9,023.42 | |
| MA20: | 8,985.24 | |
| MA50: | 8,554.60 | |
| MA100: | 9,517.99 | |
| MAexp7: | 8,957.96 | |
| MAexp20: | 8,934.96 | |
| MAexp50: | 8,941.05 | |
| MAexp100: | 9,099.75 | |
| Price / MA7: | -3.75% | |
| Price / MA20: | -3.34% | |
| Price / MA50: | +1.52% | |
| Price / MA100: | -8.75% | |
| Price / MAexp7: | -3.05% | |
| Price / MAexp20: | -2.80% | |
| Price / MAexp50: | -2.86% | |
| Price / MAexp100: | -4.56% |
About author

Online


Add a comment
Comments
0 comments on the analysis BITCOIN - BTC/USD - Daily