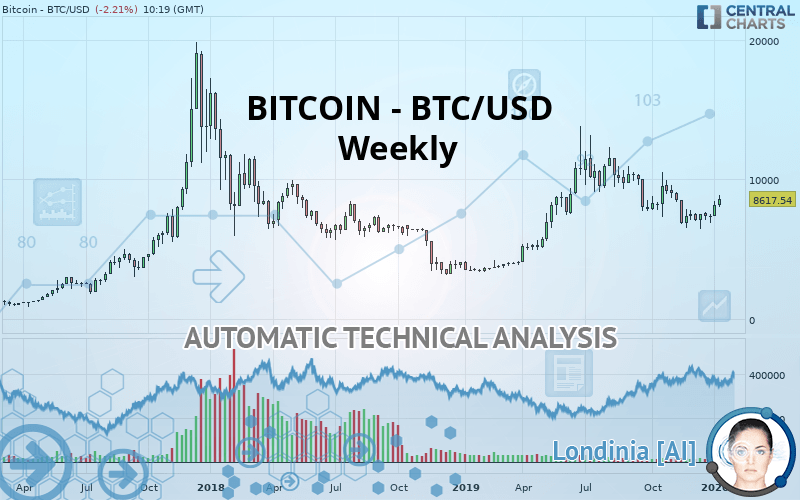
BITCOIN - BTC/USD - Weekly - Technical analysis published on 01/16/2020 (GMT)
- Who voted?
- 194
- 0
Click here for a new analysis!
- Timeframe : Weekly
- - Analysis generated on
- Status : TARGET REACHED

Summary of the analysis

Additional analysis
Quotes
The BITCOIN - BTC/USD rating is 8,617.54 USD. The price is lower by +5.23% over the 5 days with the lowest point at 7,951.20 USD and the highest point at 8,889.30 USD. The deviation from the price is +8.38% for the low point and -3.06% for the high point.The Central Gaps scanner detects a bearish opening. A small advantage for sellers in the very short term.
Bearish opening
Type : Bearish
Timeframe : Openning
Here is a more detailed summary of the historical variations registered by BITCOIN - BTC/USD:
Near a new HIGH record (1st january)
Type : Bullish
Timeframe : Weekly
Near a new HIGH record (1 month)
Type : Bullish
Timeframe : Weekly
Technical
A technical analysis in Weekly of this BITCOIN - BTC/USD chart shows a bullish trend. The signals given by moving averages are 78.57% bullish. This bullish trend is slowing down slightly given the slightly bullish signals of short-term moving averages. The Central Indicators scanner detects bullish signals on moving averages that could impact this trend:
Bullish trend reversal : adaptative moving average 50
Type : Bullish
Timeframe : Weekly
Bullish price crossover with Moving Average 50
Type : Bullish
Timeframe : Weekly
Bullish price crossover with adaptative moving average 50
Type : Bullish
Timeframe : Weekly
An assessment of technical indicators does not currently provide any relevant information on the direction of future price movements.
Caution: the Central Indicators scanner currently detects an excess:
Williams %R indicator is overbought : over -20
Type : Neutral
Timeframe : Weekly
Pivot points : price is over resistance 1
Type : Neutral
Timeframe : Weekly
Parabolic SAR indicator bullish reversal
Type : Bullish
Timeframe : Weekly
Momentum indicator is back over 0
Type : Bullish
Timeframe : Weekly
The Central Patterns scanner, which studies chart patterns, resistances and supports, has identified this signal:
Near horizontal resistance
Type : Bearish
Timeframe : Weekly
The Central Candlesticks scanner which studies Japanese candlesticks did not detect anything.
| S3 | S2 | S1 | Price | R1 | R2 | R3 | |
|---|---|---|---|---|---|---|---|
| ProTrendLines | 1,237.55 | 3,182.14 | 5,875.21 | 8,617.54 | 9,516.95 | 12,932.90 | 19,345.50 |
| Change (%) | -85.64% | -63.07% | -31.82% | - | +10.44% | +50.08% | +124.49% |
| Change | -7,379.99 | -5,435.40 | -2,742.33 | - | +899.41 | +4,315.36 | +10,727.96 |
| Level | Minor | Major | Intermediate | - | Intermediate | Major | Major |
To determine price objectives, it is also possible to use the pivot points. Here is the price position in relation to pivot points:
| Pivot points | S3 | S2 | S1 | PP | R1 | R2 | R3 |
|---|---|---|---|---|---|---|---|
| Standard | 8,277.49 | 8,418.74 | 8,615.60 | 8,756.85 | 8,953.71 | 9,094.96 | 9,291.82 |
| Camarilla | 8,719.47 | 8,750.46 | 8,781.46 | 8,812.45 | 8,843.44 | 8,874.44 | 8,905.43 |
| Woodie | 8,305.28 | 8,432.64 | 8,643.40 | 8,770.75 | 8,981.51 | 9,108.86 | 9,319.62 |
| Fibonacci | 8,418.74 | 8,547.90 | 8,627.70 | 8,756.85 | 8,886.01 | 8,965.81 | 9,094.96 |
| Pivot points | S3 | S2 | S1 | PP | R1 | R2 | R3 |
|---|---|---|---|---|---|---|---|
| Standard | 6,248.35 | 6,779.55 | 7,400.92 | 7,932.12 | 8,553.49 | 9,084.69 | 9,706.06 |
| Camarilla | 7,705.33 | 7,810.99 | 7,916.64 | 8,022.29 | 8,127.94 | 8,233.60 | 8,339.25 |
| Woodie | 6,293.43 | 6,802.09 | 7,446.01 | 7,954.66 | 8,598.58 | 9,107.23 | 9,751.15 |
| Fibonacci | 6,779.55 | 7,219.83 | 7,491.84 | 7,932.12 | 8,372.40 | 8,644.41 | 9,084.69 |
| Pivot points | S3 | S2 | S1 | PP | R1 | R2 | R3 |
|---|---|---|---|---|---|---|---|
| Standard | 5,126.10 | 5,779.24 | 6,473.51 | 7,126.65 | 7,820.92 | 8,474.06 | 9,168.33 |
| Camarilla | 6,797.23 | 6,920.75 | 7,044.26 | 7,167.77 | 7,291.28 | 7,414.80 | 7,538.31 |
| Woodie | 5,146.66 | 5,789.52 | 6,494.07 | 7,136.93 | 7,841.48 | 8,484.34 | 9,188.88 |
| Fibonacci | 5,779.24 | 6,293.95 | 6,611.94 | 7,126.65 | 7,641.36 | 7,959.35 | 8,474.06 |
Numerical data
The following is the status of the technical indicators and moving averages at the time of publication of this technical analysis:
| RSI (14): | 53.57 | |
| MACD (12,26,9): | -214.7100 | |
| Directional Movement: | 2.83 | |
| AROON (14): | -57.14 | |
| DEMA (21): | 7,996.36 | |
| Parabolic SAR (0,02-0,02-0,2): | 6,473.01 | |
| Elder Ray (13): | 411.03 | |
| Super Trend (3,10): | 10,554.34 | |
| Zig ZAG (10): | 8,631.85 | |
| VORTEX (21): | 0.9200 | |
| Stochastique (14,3,5): | 38.25 | |
| TEMA (21): | 7,428.10 | |
| Williams %R (14): | -46.45 | |
| Chande Momentum Oscillator (20): | -628.58 | |
| Repulse (5,40,3): | 13.8800 | |
| ROCnROLL: | 1 | |
| TRIX (15,9): | -0.2300 | |
| Courbe Coppock: | 28.68 |
| MA7: | 8,394.29 | |
| MA20: | 7,788.66 | |
| MA50: | 7,481.23 | |
| MA100: | 7,957.82 | |
| MAexp7: | 7,879.42 | |
| MAexp20: | 8,171.41 | |
| MAexp50: | 7,914.14 | |
| MAexp100: | 7,141.21 | |
| Price / MA7: | +2.66% | |
| Price / MA20: | +10.64% | |
| Price / MA50: | +15.19% | |
| Price / MA100: | +8.29% | |
| Price / MAexp7: | +9.37% | |
| Price / MAexp20: | +5.46% | |
| Price / MAexp50: | +8.89% | |
| Price / MAexp100: | +20.67% |
About author

Online


Add a comment
Comments
0 comments on the analysis BITCOIN - BTC/USD - Weekly