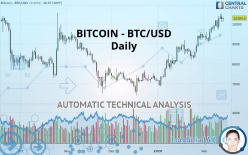
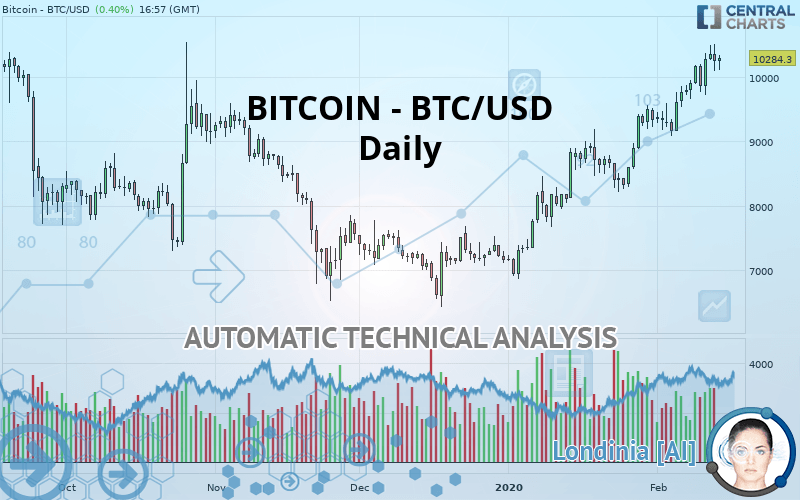
BITCOIN - BTC/USD - Daily - Technical analysis published on 02/14/2020 (GMT)
- Who voted?
- 242
- 0
Click here for a new analysis!
- Timeframe : Daily
- - Analysis generated on
- Status : INVALID
Summary of the analysis

Additional analysis
Quotes
The BITCOIN - BTC/USD rating is 10,284.30 USD. The price has increased by +0.40% since the last closing and was between 10,099.70 USD and 10,341.10 USD. This implies that the price is at +1.83% from its lowest and at -0.55% from its highest.The Central Gaps scanner detects a bearish opening. A small advantage for sellers in the very short term.
Bearish opening
Type : Bearish
Timeframe : Openning
So that you have an overall view of the price change, here is a table showing the variations over several periods:
Near a new HIGH record (1st january)
Type : Bullish
Timeframe : Weekly
Near a new HIGH record (1 month)
Type : Bullish
Timeframe : Weekly
Technical
A technical analysis in Daily of this BITCOIN - BTC/USD chart shows a strongly bullish trend. The signals given by the moving averages are 92.86% bullish. This strong bullish trend is confirmed by the strong signals currently being given by short-term moving averages. The Central Indicators scanner does not detect any result on moving averages that would impact this trend.
Technical indicators are strongly bullish, suggesting that the price increase should continue.
Caution: the Central Indicators scanner currently detects an excess:
CCI indicator is overbought : over 100
Type : Neutral
Timeframe : Daily
CCI indicator: bearish divergence
Type : Bearish
Timeframe : Daily
RSI indicator: bearish divergence
Type : Bearish
Timeframe : Daily
Williams %R indicator is overbought : over -20
Type : Neutral
Timeframe : Daily
Pivot points : price is over resistance 1
Type : Neutral
Timeframe : Weekly
Price is back under the pivot point
Type : Bearish
Timeframe : Daily
The Central Patterns scanner, which studies chart patterns, resistances and supports, has identified these signals:
Horizontal resistance is broken
Type : Bullish
Timeframe : Daily
Resistance of channel is broken
Type : Bullish
Timeframe : Daily
Central Candlesticks, the scanner specialised in Japanese candlesticks, detects a bearish signal that could support the hypothesis of a small drop in the very short term:
Bearish engulfing lines
Type : Bearish
Timeframe : Daily
| S3 | S2 | S1 | Price | R1 | R2 | R3 | |
|---|---|---|---|---|---|---|---|
| ProTrendLines | 8,347.77 | 9,516.95 | 10,056.90 | 10,284.30 | 10,627.40 | 11,989.00 | 12,932.90 |
| Change (%) | -18.83% | -7.46% | -2.21% | - | +3.34% | +16.58% | +25.75% |
| Change | -1,936.53 | -767.35 | -227.40 | - | +343.10 | +1,704.70 | +2,648.60 |
| Level | Minor | Major | Intermediate | - | Minor | Intermediate | Intermediate |
To determine price objectives, it is also possible to use the pivot points. Here is the price position in relation to pivot points:
| Pivot points | S3 | S2 | S1 | PP | R1 | R2 | R3 |
|---|---|---|---|---|---|---|---|
| Standard | 9,623.70 | 9,852.70 | 10,047.80 | 10,276.80 | 10,471.90 | 10,700.90 | 10,896.00 |
| Camarilla | 10,126.27 | 10,165.15 | 10,204.02 | 10,242.90 | 10,281.78 | 10,320.65 | 10,359.53 |
| Woodie | 9,606.75 | 9,844.23 | 10,030.85 | 10,268.33 | 10,454.95 | 10,692.43 | 10,879.05 |
| Fibonacci | 9,852.70 | 10,014.71 | 10,114.79 | 10,276.80 | 10,438.81 | 10,538.89 | 10,700.90 |
| Pivot points | S3 | S2 | S1 | PP | R1 | R2 | R3 |
|---|---|---|---|---|---|---|---|
| Standard | 8,478.53 | 8,778.77 | 9,341.53 | 9,641.77 | 10,204.53 | 10,504.77 | 11,067.53 |
| Camarilla | 9,666.98 | 9,746.08 | 9,825.19 | 9,904.30 | 9,983.41 | 10,062.52 | 10,141.63 |
| Woodie | 8,609.80 | 8,844.40 | 9,472.80 | 9,707.40 | 10,335.80 | 10,570.40 | 11,198.80 |
| Fibonacci | 8,778.77 | 9,108.43 | 9,312.10 | 9,641.77 | 9,971.43 | 10,175.10 | 10,504.77 |
| Pivot points | S3 | S2 | S1 | PP | R1 | R2 | R3 |
|---|---|---|---|---|---|---|---|
| Standard | 4,903.28 | 5,881.93 | 7,607.71 | 8,586.36 | 10,312.14 | 11,290.79 | 13,016.57 |
| Camarilla | 8,589.78 | 8,837.69 | 9,085.59 | 9,333.50 | 9,581.41 | 9,829.31 | 10,077.22 |
| Woodie | 5,276.86 | 6,068.71 | 7,981.29 | 8,773.14 | 10,685.72 | 11,477.57 | 13,390.15 |
| Fibonacci | 5,881.93 | 6,915.02 | 7,553.26 | 8,586.36 | 9,619.45 | 10,257.70 | 11,290.79 |
Numerical data
The following is the status of the technical indicators and moving averages at the time of publication of this technical analysis:
| RSI (14): | 68.74 | |
| MACD (12,26,9): | 462.0500 | |
| Directional Movement: | 16.16 | |
| AROON (14): | 64.29 | |
| DEMA (21): | 10,256.93 | |
| Parabolic SAR (0,02-0,02-0,2): | 9,868.60 | |
| Elder Ray (13): | 326.50 | |
| Super Trend (3,10): | 9,319.40 | |
| Zig ZAG (10): | 10,273.60 | |
| VORTEX (21): | 1.2700 | |
| Stochastique (14,3,5): | 85.34 | |
| TEMA (21): | 10,377.18 | |
| Williams %R (14): | -16.23 | |
| Chande Momentum Oscillator (20): | 951.90 | |
| Repulse (5,40,3): | 1.8900 | |
| ROCnROLL: | 1 | |
| TRIX (15,9): | 0.7100 | |
| Courbe Coppock: | 21.25 |
| MA7: | 10,152.53 | |
| MA20: | 9,616.92 | |
| MA50: | 8,662.66 | |
| MA100: | 8,156.90 | |
| MAexp7: | 10,124.15 | |
| MAexp20: | 9,652.62 | |
| MAexp50: | 8,957.94 | |
| MAexp100: | 8,634.71 | |
| Price / MA7: | +1.30% | |
| Price / MA20: | +6.94% | |
| Price / MA50: | +18.72% | |
| Price / MA100: | +26.08% | |
| Price / MAexp7: | +1.58% | |
| Price / MAexp20: | +6.54% | |
| Price / MAexp50: | +14.81% | |
| Price / MAexp100: | +19.10% |
About author

Online


Add a comment
Comments
0 comments on the analysis BITCOIN - BTC/USD - Daily