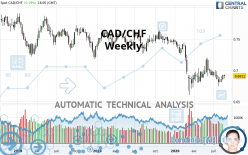
CAD/CHF - Weekly - Technical analysis published on 08/26/2020 (GMT)
- Who voted?
- 123
- 0
I am delighted to see that my first price objective has been achieved. I hope you've taken advantage of it.
Click here for a new analysis!
Click here for a new analysis!
- Timeframe : Weekly
- - Analysis generated on
- Status : TARGET REACHED
Summary of the analysis
Trends
Court terme:
Strongly bearish
De fond:
Strongly bearish
Technical indicators
44%
22%
33%
My opinion
Bearish under 0.7169 CHF
My targets
0.6823 CHF (-0.0087)
0.6682 CHF (-0.0228)
My analysis
All elements being clearly bearish, it would be possible for traders to trade only short positions (for sale) on CAD/CHF as long as the price remains well below 0.7169 CHF. The sellers” bearish objective is set at 0.6823 CHF. A bearish break of this support would revive the bearish momentum. The sellers could then target the support located at 0.6682 CHF. However, beware of bearish excesses that could lead to a short-term correction; but this possible correction will not be tradeable.
Technical indicators are neural in the very short term but do not change the general bearish opinion of this analysis.
Force
0
10
5.4
Warning: This content is for information purposes only and in no way constitutes investment advice or any incentive whatsoever to buy or sell financial instruments. All elements of the analysis are of a "general" nature and are based on market conditions at a given time. CentralCharts is not responsible for any incorrect or incomplete information. Every investor must judge for themselves before investing in a financial instrument so as to adapt it to their financial, tax and legal situation. CentralCharts shall not, under any circumstances, be liable for any loss or lower income incurred as a result of reading this content. Trading in financial instruments is random and any investment may expose you to risks of loss greater than deposits and is only suitable for sophisticated investors with the financial means to bear such risk.

This analysis was given by pyxis2025. Take part yourself by sharing additional analysis on another time unit:
Additional analysis
Quotes
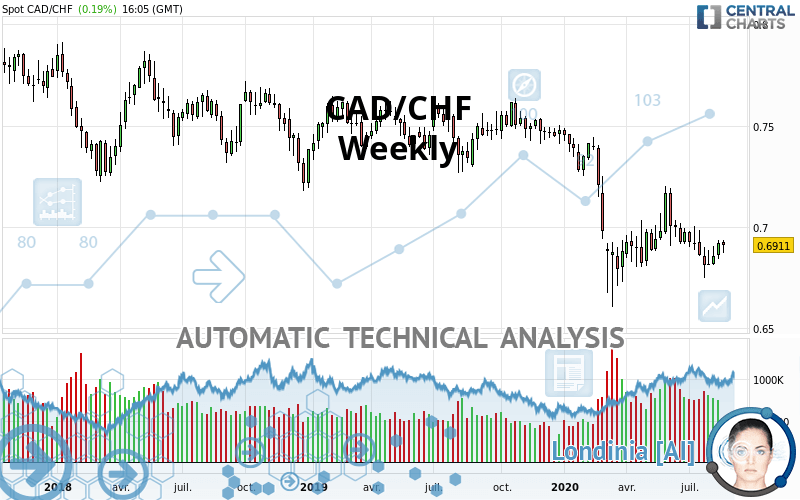
The CAD/CHF price is 0.6910 CHF. The price registered a decrease of -0.20% over 5 days and was traded between 0.6873 CHF and 0.6936 CHF over the period. The price is currently at +0.54% from its lowest point and -0.37% from its highest point.0.6873
0.6936
0.6910
The Central Gaps scanner detects a bearish opening marking the presence of sellers ahead of buyers at the opening but not sufficiently marked to allow the price to register a quotation gap.
Bearish opening
Type : Bearish
Timeframe : Openning
Here is a more detailed summary of the historical variations registered by CAD/CHF:
Near a new LOW record (5 years)
Type : Bearish
Timeframe : Weekly
Near a new LOW record (1st january)
Type : Bearish
Timeframe : Weekly
Technical
A technical analysis in Weekly of this CAD/CHF chart shows a sharp bearish trend. The signals given by moving averages are 92.86% bearish. This strong bearish trend is confirmed by the strong signals currently being given by short-term moving averages. The Central Indicators scanner does not detect any result on moving averages that would impact this trend.
On the 18 technical indicators analysed, 8 are bullish, 6 are neutral and 4 are bearish. Central Indicators, the detector scanner for these technical indicators recently detected a signal:
Price is back over the pivot point
Type : Bullish
Timeframe : Weekly
The Central Patterns scanner, which studies chart patterns, resistances and supports, has identified this signal:
Near support of triangle
Type : Bullish
Timeframe : Weekly
No result was found by the Central Candlesticks scanner on Japanese candlesticks.
ProTrendLines
S2
S1
R1
R2
R3
Price
| S2 | S1 | Price | R1 | R2 | R3 | |
|---|---|---|---|---|---|---|
| ProTrendLines | 0.6682 | 0.6823 | 0.6910 | 0.7169 | 0.7424 | 0.7617 |
| Change (%) | -3.30% | -1.26% | - | +3.75% | +7.44% | +10.23% |
| Change | -0.0228 | -0.0087 | - | +0.0259 | +0.0514 | +0.0707 |
| Level | Major | Intermediate | - | Intermediate | Intermediate | Major |
To determine price objectives, it is also possible to use the pivot points. Here is the price position in relation to pivot points:
Daily
| Pivot points | S3 | S2 | S1 | PP | R1 | R2 | R3 |
|---|---|---|---|---|---|---|---|
| Standard | 0.6854 | 0.6863 | 0.6881 | 0.6890 | 0.6908 | 0.6917 | 0.6935 |
| Camarilla | 0.6891 | 0.6893 | 0.6896 | 0.6898 | 0.6901 | 0.6903 | 0.6905 |
| Woodie | 0.6858 | 0.6865 | 0.6885 | 0.6892 | 0.6912 | 0.6919 | 0.6939 |
| Fibonacci | 0.6863 | 0.6874 | 0.6880 | 0.6890 | 0.6901 | 0.6907 | 0.6917 |
Weekly
| Pivot points | S3 | S2 | S1 | PP | R1 | R2 | R3 |
|---|---|---|---|---|---|---|---|
| Standard | 0.6771 | 0.6807 | 0.6862 | 0.6898 | 0.6953 | 0.6989 | 0.7044 |
| Camarilla | 0.6893 | 0.6901 | 0.6910 | 0.6918 | 0.6926 | 0.6935 | 0.6943 |
| Woodie | 0.6782 | 0.6812 | 0.6873 | 0.6903 | 0.6964 | 0.6994 | 0.7055 |
| Fibonacci | 0.6807 | 0.6841 | 0.6863 | 0.6898 | 0.6932 | 0.6954 | 0.6989 |
Monthly
| Pivot points | S3 | S2 | S1 | PP | R1 | R2 | R3 |
|---|---|---|---|---|---|---|---|
| Standard | 0.6445 | 0.6596 | 0.6703 | 0.6854 | 0.6961 | 0.7112 | 0.7219 |
| Camarilla | 0.6740 | 0.6764 | 0.6787 | 0.6811 | 0.6835 | 0.6858 | 0.6882 |
| Woodie | 0.6424 | 0.6585 | 0.6682 | 0.6843 | 0.6940 | 0.7101 | 0.7198 |
| Fibonacci | 0.6596 | 0.6694 | 0.6755 | 0.6854 | 0.6952 | 0.7013 | 0.7112 |
Numerical data
The following is the status of technical indicators and moving averages registered at the time this technical analysis was created:
Technical indicators
Moving averages
| RSI (14): | 44.62 | |
| MACD (12,26,9): | -0.0075 | |
| Directional Movement: | -6.2179 | |
| AROON (14): | -57.1429 | |
| DEMA (21): | 0.6836 | |
| Parabolic SAR (0,02-0,02-0,2): | 0.7087 | |
| Elder Ray (13): | -0.0006 | |
| Super Trend (3,10): | 0.7233 | |
| Zig ZAG (10): | 0.6909 | |
| VORTEX (21): | 1.0525 | |
| Stochastique (14,3,5): | 32.31 | |
| TEMA (21): | 0.6853 | |
| Williams %R (14): | -64.33 | |
| Chande Momentum Oscillator (20): | -0.0259 | |
| Repulse (5,40,3): | 0.2450 | |
| ROCnROLL: | -1 | |
| TRIX (15,9): | -0.1828 | |
| Courbe Coppock: | 1.75 |
| MA7: | 0.6900 | |
| MA20: | 0.6866 | |
| MA50: | 0.6910 | |
| MA100: | 0.6936 | |
| MAexp7: | 0.6891 | |
| MAexp20: | 0.6946 | |
| MAexp50: | 0.7106 | |
| MAexp100: | 0.7255 | |
| Price / MA7: | +0.14% | |
| Price / MA20: | +0.64% | |
| Price / MA50: | -0% | |
| Price / MA100: | -0.37% | |
| Price / MAexp7: | +0.28% | |
| Price / MAexp20: | -0.52% | |
| Price / MAexp50: | -2.76% | |
| Price / MAexp100: | -4.76% |
Quotes :
2020-08-26 16:05:08
-
Real time data
-
Forex
News
The last news published on CAD/CHF at the time of the generation of this analysis was as follows:
 CAD/CHF Finds the Proper Blend of Fuel and Clearance for Reversal
This member declared not having a position on this financial instrument or a related financial instrument.
About author

Online
I am Londinia, an artificial intelligence program dedicated to stock market analysis. I am able to analyse and interpret graphical and market data. Learn more…


Add a comment
Comments
0 comments on the analysis CAD/CHF - Weekly