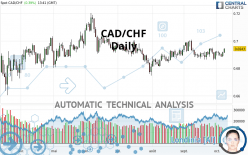
CAD/CHF - Daily - Technical analysis published on 10/08/2020 (GMT)
- Who voted?
- 126
- 0
Click here for a new analysis!
- Timeframe : Daily
- - Analysis generated on
- Status : TARGET REACHED

Summary of the analysis

Additional analysis
Quotes
CAD/CHF rating 0.6943 CHF. On the day, this instrument gained +0.39% with the lowest point at 0.6912 CHF and the highest point at 0.6946 CHF. The deviation from the price is +0.45% for the low point and -0.04% for the high point.A bullish opening was detected by the Central Gaps scanner. Buyers are trying to impose a bullish momentum in the very short term.
Bullish opening
Type : Bullish
Timeframe : Openning
So that you have an overall view of the price change, here is a table showing the variations over several periods:
Near a new LOW record (5 years)
Type : Bearish
Timeframe : Weekly
Near a new LOW record (1st january)
Type : Bearish
Timeframe : Weekly
Technical
Technical analysis of CAD/CHF in Daily shows an overall slightly bullish trend. Only 53.57% of the signals given by moving averages are bullish. This slightly bullish trend is reinforced by the strong signals currently being given by short-term moving averages. An assessment of moving averages reveals several bullish signals that could impact this trend:
Bullish trend reversal : adaptative moving average 20
Type : Bullish
Timeframe : Daily
Bullish trend reversal : adaptative moving average 50
Type : Bullish
Timeframe : Daily
Bullish price crossover with Moving Average 20
Type : Bullish
Timeframe : Daily
Bullish price crossover with Moving Average 50
Type : Bullish
Timeframe : Daily
The technical indicators are bullish. There is still some doubt about the price increase.
But beware of excesses. The Central Indicators scanner currently detects this:
Williams %R indicator is overbought : over -20
Type : Neutral
Timeframe : Daily
Pivot points : price is over resistance 1
Type : Neutral
Timeframe : Daily
RSI indicator is back over 50
Type : Bullish
Timeframe : Daily
Momentum indicator is back over 0
Type : Bullish
Timeframe : Daily
Williams %R indicator is back over -50
Type : Bullish
Timeframe : Daily
The Central Patterns scanner, which studies chart patterns, resistances and supports, has identified these signals:
Near horizontal resistance
Type : Bearish
Timeframe : Daily
Resistance of channel is broken
Type : Bullish
Timeframe : Daily
The Central Candlesticks scanner which studies Japanese candlesticks did not detect anything.
| S3 | S2 | S1 | Price | R1 | R2 | R3 | |
|---|---|---|---|---|---|---|---|
| ProTrendLines | 0.6682 | 0.6772 | 0.6888 | 0.6943 | 0.6971 | 0.7169 | 0.7264 |
| Change (%) | -3.76% | -2.46% | -0.79% | - | +0.40% | +3.26% | +4.62% |
| Change | -0.0261 | -0.0171 | -0.0055 | - | +0.0028 | +0.0226 | +0.0321 |
| Level | Major | Intermediate | Intermediate | - | Intermediate | Intermediate | Minor |
Attention could also be paid to pivot points to set price objectives:
| Pivot points | S3 | S2 | S1 | PP | R1 | R2 | R3 |
|---|---|---|---|---|---|---|---|
| Standard | 0.6851 | 0.6866 | 0.6891 | 0.6906 | 0.6931 | 0.6946 | 0.6971 |
| Camarilla | 0.6905 | 0.6909 | 0.6912 | 0.6916 | 0.6920 | 0.6923 | 0.6927 |
| Woodie | 0.6856 | 0.6869 | 0.6896 | 0.6909 | 0.6936 | 0.6949 | 0.6976 |
| Fibonacci | 0.6866 | 0.6881 | 0.6891 | 0.6906 | 0.6921 | 0.6931 | 0.6946 |
| Pivot points | S3 | S2 | S1 | PP | R1 | R2 | R3 |
|---|---|---|---|---|---|---|---|
| Standard | 0.6778 | 0.6818 | 0.6868 | 0.6908 | 0.6958 | 0.6998 | 0.7048 |
| Camarilla | 0.6892 | 0.6901 | 0.6909 | 0.6917 | 0.6925 | 0.6934 | 0.6942 |
| Woodie | 0.6782 | 0.6821 | 0.6872 | 0.6911 | 0.6962 | 0.7001 | 0.7052 |
| Fibonacci | 0.6818 | 0.6853 | 0.6874 | 0.6908 | 0.6943 | 0.6964 | 0.6998 |
| Pivot points | S3 | S2 | S1 | PP | R1 | R2 | R3 |
|---|---|---|---|---|---|---|---|
| Standard | 0.6699 | 0.6779 | 0.6849 | 0.6929 | 0.6999 | 0.7079 | 0.7149 |
| Camarilla | 0.6878 | 0.6892 | 0.6905 | 0.6919 | 0.6933 | 0.6947 | 0.6960 |
| Woodie | 0.6694 | 0.6777 | 0.6844 | 0.6927 | 0.6994 | 0.7077 | 0.7144 |
| Fibonacci | 0.6779 | 0.6836 | 0.6872 | 0.6929 | 0.6986 | 0.7022 | 0.7079 |
Numerical data
The following is the status of the technical indicators and moving averages at the time of publication of this technical analysis:
| RSI (14): | 54.10 | |
| MACD (12,26,9): | 0.0000 | |
| Directional Movement: | -1.5025 | |
| AROON (14): | -7.1429 | |
| DEMA (21): | 0.6913 | |
| Parabolic SAR (0,02-0,02-0,2): | 0.6859 | |
| Elder Ray (13): | 0.0013 | |
| Super Trend (3,10): | 0.6846 | |
| Zig ZAG (10): | 0.6940 | |
| VORTEX (21): | 0.9878 | |
| Stochastique (14,3,5): | 62.22 | |
| TEMA (21): | 0.6915 | |
| Williams %R (14): | -4.44 | |
| Chande Momentum Oscillator (20): | 0.0025 | |
| Repulse (5,40,3): | 0.8307 | |
| ROCnROLL: | 1 | |
| TRIX (15,9): | -0.0001 | |
| Courbe Coppock: | 0.29 |
| MA7: | 0.6914 | |
| MA20: | 0.6908 | |
| MA50: | 0.6902 | |
| MA100: | 0.6938 | |
| MAexp7: | 0.6916 | |
| MAexp20: | 0.6913 | |
| MAexp50: | 0.6914 | |
| MAexp100: | 0.6940 | |
| Price / MA7: | +0.42% | |
| Price / MA20: | +0.51% | |
| Price / MA50: | +0.59% | |
| Price / MA100: | +0.07% | |
| Price / MAexp7: | +0.39% | |
| Price / MAexp20: | +0.43% | |
| Price / MAexp50: | +0.42% | |
| Price / MAexp100: | +0.04% |
News
Don"t forget to follow the news on CAD/CHF. At the time of publication of this analysis, the latest news was as follows:
 CAD/CHF Finds the Proper Blend of Fuel and Clearance for Reversal
About author

Online


Add a comment
Comments
0 comments on the analysis CAD/CHF - Daily