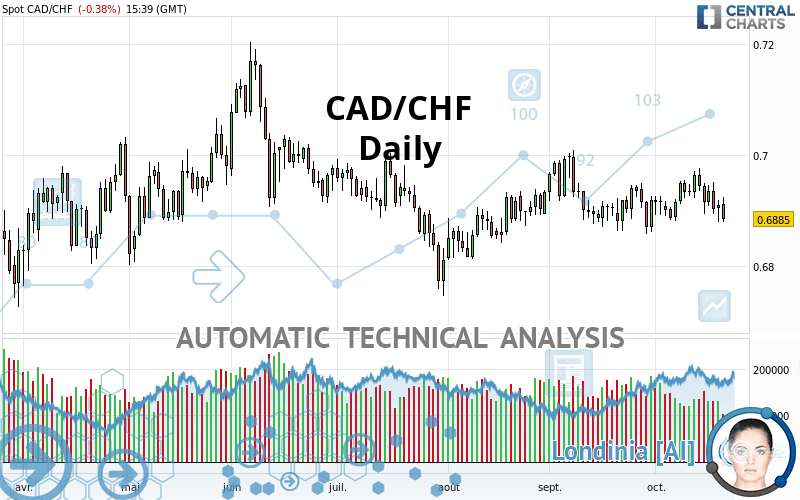
CAD/CHF - Daily - Technical analysis published on 10/21/2020 (GMT)
- 150
- 0
Click here for a new analysis!
- Timeframe : Daily
- - Analysis generated on
- Status : INVALID

Summary of the analysis

Additional analysis
Quotes
CAD/CHF rating 0.6885 CHF. The price registered a decrease of -0.38% on the session and was between 0.6880 CHF and 0.6925 CHF. This implies that the price is at +0.07% from its lowest and at -0.58% from its highest.The Central Gaps scanner detects a bullish opening. A small advantage for buyers in the very short term.
Bullish opening
Type : Bullish
Timeframe : Openning
A study of price movements over other periods shows the following variations:
Near a new LOW record (5 years)
Type : Bearish
Timeframe : Weekly
Near a new LOW record (1st january)
Type : Bearish
Timeframe : Weekly
Technical
A technical analysis in Daily of this CAD/CHF chart shows a bearish trend. The signals given by moving averages are at 75.00% bearish. This bearish trend shows slight signs of slowing down given the slightly bearish signals of short-term moving averages. An assessment of moving averages reveals a bearish signal that could impact this trend:
Bearish trend reversal : Moving Average 20
Type : Bearish
Timeframe : Daily
An assessment of technical indicators shows a slightly bearish signal.
Central Indicators, the detector scanner for these technical indicators has recently detected several signals:
Pivot points : price is under support 1
Type : Neutral
Timeframe : Weekly
Parabolic SAR indicator bearish reversal
Type : Bearish
Timeframe : Daily
Price is back over the pivot point
Type : Bullish
Timeframe : Weekly
Central Patterns, the market scanner focusing on chart patterns, resistances and supports found these results:
Near horizontal support
Type : Bullish
Timeframe : Daily
Near support of triangle
Type : Bullish
Timeframe : Daily
Support of channel is broken
Type : Bearish
Timeframe : Daily
For a small rebound in the very short term, the Central Candlesticks scanner currently notes the presence of this bullish pattern in Japanese candlesticks:
Bullish harami
Type : Bullish
Timeframe : Daily
| S2 | S1 | Price | R1 | R2 | R3 | |
|---|---|---|---|---|---|---|
| ProTrendLines | 0.6682 | 0.6773 | 0.6885 | 0.6888 | 0.6998 | 0.7169 |
| Change (%) | -2.95% | -1.63% | - | +0.04% | +1.64% | +4.12% |
| Change | -0.0203 | -0.0112 | - | +0.0003 | +0.0113 | +0.0284 |
| Level | Minor | Major | - | Major | Intermediate | Intermediate |
Attention could also be paid to pivot points to set price objectives:
| Pivot points | S3 | S2 | S1 | PP | R1 | R2 | R3 |
|---|---|---|---|---|---|---|---|
| Standard | 0.6849 | 0.6864 | 0.6888 | 0.6903 | 0.6927 | 0.6942 | 0.6966 |
| Camarilla | 0.6900 | 0.6904 | 0.6907 | 0.6911 | 0.6915 | 0.6918 | 0.6922 |
| Woodie | 0.6853 | 0.6866 | 0.6892 | 0.6905 | 0.6931 | 0.6944 | 0.6970 |
| Fibonacci | 0.6864 | 0.6879 | 0.6888 | 0.6903 | 0.6918 | 0.6927 | 0.6942 |
| Pivot points | S3 | S2 | S1 | PP | R1 | R2 | R3 |
|---|---|---|---|---|---|---|---|
| Standard | 0.6811 | 0.6853 | 0.6894 | 0.6936 | 0.6977 | 0.7019 | 0.7060 |
| Camarilla | 0.6913 | 0.6921 | 0.6928 | 0.6936 | 0.6944 | 0.6951 | 0.6959 |
| Woodie | 0.6812 | 0.6853 | 0.6895 | 0.6936 | 0.6978 | 0.7019 | 0.7061 |
| Fibonacci | 0.6853 | 0.6884 | 0.6904 | 0.6936 | 0.6967 | 0.6987 | 0.7019 |
| Pivot points | S3 | S2 | S1 | PP | R1 | R2 | R3 |
|---|---|---|---|---|---|---|---|
| Standard | 0.6699 | 0.6779 | 0.6849 | 0.6929 | 0.6999 | 0.7079 | 0.7149 |
| Camarilla | 0.6878 | 0.6892 | 0.6905 | 0.6919 | 0.6933 | 0.6947 | 0.6960 |
| Woodie | 0.6694 | 0.6777 | 0.6844 | 0.6927 | 0.6994 | 0.7077 | 0.7144 |
| Fibonacci | 0.6779 | 0.6836 | 0.6872 | 0.6929 | 0.6986 | 0.7022 | 0.7079 |
Numerical data
The following is the status of technical indicators and moving averages registered at the time this technical analysis was created:
| RSI (14): | 44.81 | |
| MACD (12,26,9): | 0.0000 | |
| Directional Movement: | -4.5700 | |
| AROON (14): | -28.5714 | |
| DEMA (21): | 0.6919 | |
| Parabolic SAR (0,02-0,02-0,2): | 0.6975 | |
| Elder Ray (13): | -0.0013 | |
| Super Trend (3,10): | 0.6846 | |
| Zig ZAG (10): | 0.6884 | |
| VORTEX (21): | 1.0222 | |
| Stochastique (14,3,5): | 22.54 | |
| TEMA (21): | 0.6915 | |
| Williams %R (14): | -96.91 | |
| Chande Momentum Oscillator (20): | -0.0017 | |
| Repulse (5,40,3): | -0.6738 | |
| ROCnROLL: | 2 | |
| TRIX (15,9): | 0.0067 | |
| Courbe Coppock: | 0.27 |
| MA7: | 0.6923 | |
| MA20: | 0.6920 | |
| MA50: | 0.6916 | |
| MA100: | 0.6929 | |
| MAexp7: | 0.6913 | |
| MAexp20: | 0.6918 | |
| MAexp50: | 0.6918 | |
| MAexp100: | 0.6937 | |
| Price / MA7: | -0.55% | |
| Price / MA20: | -0.51% | |
| Price / MA50: | -0.45% | |
| Price / MA100: | -0.64% | |
| Price / MAexp7: | -0.41% | |
| Price / MAexp20: | -0.48% | |
| Price / MAexp50: | -0.48% | |
| Price / MAexp100: | -0.75% |
News
The last news published on CAD/CHF at the time of the generation of this analysis was as follows:
 CAD/CHF Finds the Proper Blend of Fuel and Clearance for Reversal
About author

Online


Add a comment
Comments
0 comments on the analysis CAD/CHF - Daily