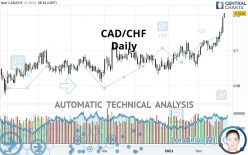
CAD/CHF - Daily - Technical analysis published on 02/24/2021 (GMT)
- 204
- 0
Click here for a new analysis!
- Timeframe : Daily
- - Analysis generated on
- Status : TARGET REACHED

Summary of the analysis

Additional analysis
Quotes
The CAD/CHF price is 0.7214 CHF. On the day, this instrument gained +0.36% and was between 0.7187 CHF and 0.7215 CHF. This implies that the price is at +0.38% from its lowest and at -0.01% from its highest.A study of price movements over other periods shows the following variations:
New HIGH record (1 year)
Type : Bullish
Timeframe : Weekly
New HIGH record (1st january)
Type : Bullish
Timeframe : Weekly
Near a new LOW record (1st january)
Type : Bearish
Timeframe : Weekly
New HIGH record (1 month)
Type : Bullish
Timeframe : Weekly
Near a new LOW record (1 month)
Type : Bearish
Timeframe : Weekly
Technical
Technical analysis of CAD/CHF in Daily shows a strongly overall bullish trend. 92.86% of the signals given by moving averages are bullish. The overall trend is supported by the strong bullish signals from short-term moving averages. There is no crossing of moving average by the price or crossing of moving averages between themselves.
An assessment of technical indicators shows a strong bullish signal.
Caution: the Central Indicators scanner currently detects an excess:
RSI indicator is overbought : over 70
Type : Neutral
Timeframe : Daily
CCI indicator is overbought : over 100
Type : Neutral
Timeframe : Daily
Williams %R indicator is overbought : over -20
Type : Neutral
Timeframe : Daily
Pivot points : price is over resistance 2
Type : Neutral
Timeframe : Weekly
Price is back over the pivot point
Type : Bullish
Timeframe : Daily
The Central Patterns scanner, which studies chart patterns, resistances and supports, has identified these signals:
Horizontal resistance is broken
Type : Bullish
Timeframe : Daily
Resistance of channel is broken
Type : Bullish
Timeframe : Daily
The Central Candlesticks scanner, specialised in Japanese candlesticks, did not identify any signals.
| S3 | S2 | S1 | Price | R1 | R2 | R3 | |
|---|---|---|---|---|---|---|---|
| ProTrendLines | 0.6924 | 0.7021 | 0.7169 | 0.7214 | 0.7240 | 0.7424 | 0.7617 |
| Change (%) | -4.02% | -2.68% | -0.62% | - | +0.36% | +2.91% | +5.59% |
| Change | -0.0290 | -0.0193 | -0.0045 | - | +0.0026 | +0.0210 | +0.0403 |
| Level | Major | Major | Minor | - | Minor | Minor | Major |
To determine price objectives, it is also possible to use the pivot points. Here is the price position in relation to pivot points:
| Pivot points | S3 | S2 | S1 | PP | R1 | R2 | R3 |
|---|---|---|---|---|---|---|---|
| Standard | 0.7031 | 0.7065 | 0.7127 | 0.7161 | 0.7223 | 0.7257 | 0.7319 |
| Camarilla | 0.7162 | 0.7170 | 0.7179 | 0.7188 | 0.7197 | 0.7206 | 0.7214 |
| Woodie | 0.7044 | 0.7072 | 0.7140 | 0.7168 | 0.7236 | 0.7264 | 0.7332 |
| Fibonacci | 0.7065 | 0.7102 | 0.7125 | 0.7161 | 0.7198 | 0.7221 | 0.7257 |
| Pivot points | S3 | S2 | S1 | PP | R1 | R2 | R3 |
|---|---|---|---|---|---|---|---|
| Standard | 0.6956 | 0.6988 | 0.7047 | 0.7079 | 0.7138 | 0.7170 | 0.7229 |
| Camarilla | 0.7080 | 0.7088 | 0.7097 | 0.7105 | 0.7113 | 0.7122 | 0.7130 |
| Woodie | 0.6969 | 0.6995 | 0.7060 | 0.7086 | 0.7151 | 0.7177 | 0.7242 |
| Fibonacci | 0.6988 | 0.7023 | 0.7045 | 0.7079 | 0.7114 | 0.7136 | 0.7170 |
| Pivot points | S3 | S2 | S1 | PP | R1 | R2 | R3 |
|---|---|---|---|---|---|---|---|
| Standard | 0.6715 | 0.6801 | 0.6886 | 0.6972 | 0.7057 | 0.7143 | 0.7228 |
| Camarilla | 0.6925 | 0.6941 | 0.6956 | 0.6972 | 0.6988 | 0.7003 | 0.7019 |
| Woodie | 0.6716 | 0.6801 | 0.6887 | 0.6972 | 0.7058 | 0.7143 | 0.7229 |
| Fibonacci | 0.6801 | 0.6866 | 0.6906 | 0.6972 | 0.7037 | 0.7077 | 0.7143 |
Numerical data
The following is the status of the technical indicators and moving averages at the time of publication of this technical analysis:
| RSI (14): | 74.46 | |
| MACD (12,26,9): | 0.0045 | |
| Directional Movement: | 25.1689 | |
| AROON (14): | 57.1429 | |
| DEMA (21): | 0.7118 | |
| Parabolic SAR (0,02-0,02-0,2): | 0.7045 | |
| Elder Ray (13): | 0.0111 | |
| Super Trend (3,10): | 0.7064 | |
| Zig ZAG (10): | 0.7202 | |
| VORTEX (21): | 1.2564 | |
| Stochastique (14,3,5): | 89.58 | |
| TEMA (21): | 0.7145 | |
| Williams %R (14): | -4.93 | |
| Chande Momentum Oscillator (20): | 0.0149 | |
| Repulse (5,40,3): | 1.5464 | |
| ROCnROLL: | 1 | |
| TRIX (15,9): | 0.0592 | |
| Courbe Coppock: | 2.98 |
| MA7: | 0.7109 | |
| MA20: | 0.7048 | |
| MA50: | 0.6991 | |
| MA100: | 0.6966 | |
| MAexp7: | 0.7125 | |
| MAexp20: | 0.7065 | |
| MAexp50: | 0.7014 | |
| MAexp100: | 0.6983 | |
| Price / MA7: | +1.48% | |
| Price / MA20: | +2.36% | |
| Price / MA50: | +3.19% | |
| Price / MA100: | +3.56% | |
| Price / MAexp7: | +1.25% | |
| Price / MAexp20: | +2.11% | |
| Price / MAexp50: | +2.85% | |
| Price / MAexp100: | +3.31% |
News
The latest news and videos published on CAD/CHF at the time of the analysis were as follows:
 CAD/CHF Finds the Proper Blend of Fuel and Clearance for Reversal
About author

Online


Add a comment
Comments
0 comments on the analysis CAD/CHF - Daily