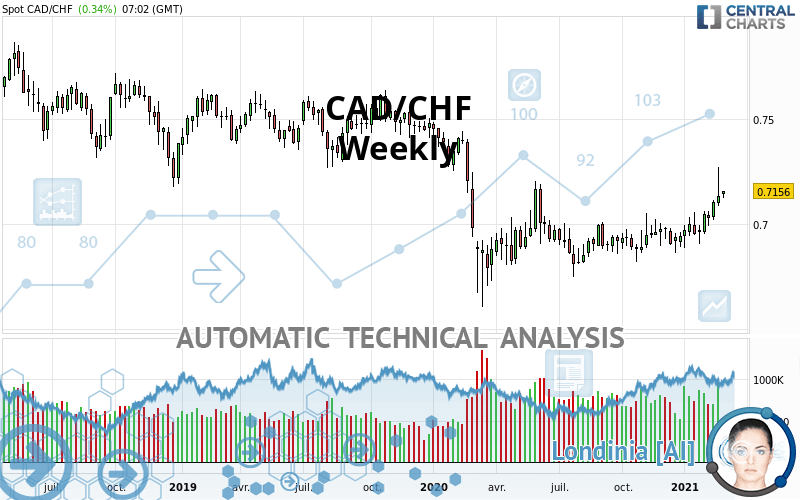
CAD/CHF - Weekly - Technical analysis published on 03/01/2021 (GMT)
- 233
- 0
I am delighted to see that my first price objective has been achieved. I hope you've taken advantage of it.
Click here for a new analysis!
Click here for a new analysis!
- Timeframe : Weekly
- - Analysis generated on
- Status : TARGET REACHED

Summary of the analysis
Trends
Court terme:
Strongly bullish
De fond:
Slightly bullish
Technical indicators
83%
0%
17%
My opinion
Bullish above 0.7021 CHF
My targets
0.7240 CHF (+0.0084)
0.7424 CHF (+0.0268)
My analysis
The short-term increase currently reinforces the basic trend, which is only slightly bullish. It would be possible for traders to only trade long positions (at the time of purchase) on CAD/CHF as long as the price remains well above 0.7021 CHF. The buyers” bullish objective is set at 0.7240 CHF. A bullish break in this resistance would boost the bullish momentum. The buyers could then target the resistance located at 0.7424 CHF. If there is any crossing, the next objective would be the resistance located at 0.7617 CHF.
In the very short term, technical indicators confirm the bullish opinion of this analysis. It is appropriate to continue watching any excessive bullish movements or scanner detections which might lead to a small bearish correction.
Force
0
10
5.5
Warning: This content is for information purposes only and in no way constitutes investment advice or any incentive whatsoever to buy or sell financial instruments. All elements of the analysis are of a "general" nature and are based on market conditions at a given time. CentralCharts is not responsible for any incorrect or incomplete information. Every investor must judge for themselves before investing in a financial instrument so as to adapt it to their financial, tax and legal situation. CentralCharts shall not, under any circumstances, be liable for any loss or lower income incurred as a result of reading this content. Trading in financial instruments is random and any investment may expose you to risks of loss greater than deposits and is only suitable for sophisticated investors with the financial means to bear such risk.

This analysis was given by savas. Take part yourself by sharing additional analysis on another time unit:
Additional analysis
Quotes
The CAD/CHF rating is 0.7156 CHF. The price registered an increase of +0.73% over 5 days and has been traded over the last 5 days between 0.7126 CHF and 0.7274 CHF. This implies that the 5 day price is +0.42% from its lowest point and -1.62% from its highest point.0.7126
0.7274
0.7156
The Central Gaps scanner detects a bullish opening. A small advantage for buyers in the very short term.
Bullish opening
Type : Bullish
Timeframe : Openning
A study of price movements over other periods shows the following variations:
Technical
Technical analysis of this Weekly chart of CAD/CHF indicates that the overall trend is slightly bullish. 60.71% of the signals given by moving averages are bullish. This slightly bullish trend could be reinforced by the strong bullish signals given by short-term moving averages. An assessment of moving averages reveals a bullish signal that could impact this trend:
Bullish price crossover with adaptative moving average 100
Type : Bullish
Timeframe : Weekly
An assessment of technical indicators shows a strong bullish signal.
But beware of excesses. The Central Indicators scanner currently detects this:
CCI indicator is overbought : over 100
Type : Neutral
Timeframe : Weekly
Previous candle closed over Bollinger bands
Type : Neutral
Timeframe : Weekly
Williams %R indicator is overbought : over -20
Type : Neutral
Timeframe : Weekly
Ichimoku : price is over the cloud
Type : Bullish
Timeframe : Weekly
An analysis of the price chart with the Central Patterns scanner (detector of chart patterns and resistances and supports) shows several results that can have an impact on the price change:
Near horizontal resistance
Type : Bearish
Timeframe : Weekly
Resistance of channel is broken
Type : Bullish
Timeframe : Weekly
The Central Candlesticks scanner, specialised in Japanese candlesticks, did not identify any signals.
ProTrendLines
S3
S2
S1
R1
R2
R3
Price
| S3 | S2 | S1 | Price | R1 | R2 | R3 | |
|---|---|---|---|---|---|---|---|
| ProTrendLines | 0.6700 | 0.6885 | 0.7021 | 0.7156 | 0.7240 | 0.7424 | 0.7617 |
| Change (%) | -6.37% | -3.79% | -1.89% | - | +1.17% | +3.75% | +6.44% |
| Change | -0.0456 | -0.0271 | -0.0135 | - | +0.0084 | +0.0268 | +0.0461 |
| Level | Major | Intermediate | Major | - | Minor | Minor | Major |
Attention could also be paid to pivot points to set price objectives:
Daily
| Pivot points | S3 | S2 | S1 | PP | R1 | R2 | R3 |
|---|---|---|---|---|---|---|---|
| Standard | 0.7047 | 0.7087 | 0.7109 | 0.7149 | 0.7171 | 0.7211 | 0.7233 |
| Camarilla | 0.7115 | 0.7121 | 0.7126 | 0.7132 | 0.7138 | 0.7143 | 0.7149 |
| Woodie | 0.7039 | 0.7083 | 0.7101 | 0.7145 | 0.7163 | 0.7207 | 0.7225 |
| Fibonacci | 0.7087 | 0.7110 | 0.7125 | 0.7149 | 0.7172 | 0.7187 | 0.7211 |
Weekly
| Pivot points | S3 | S2 | S1 | PP | R1 | R2 | R3 |
|---|---|---|---|---|---|---|---|
| Standard | 0.6866 | 0.6976 | 0.7054 | 0.7164 | 0.7242 | 0.7352 | 0.7430 |
| Camarilla | 0.7080 | 0.7098 | 0.7115 | 0.7132 | 0.7149 | 0.7167 | 0.7184 |
| Woodie | 0.6850 | 0.6968 | 0.7038 | 0.7156 | 0.7226 | 0.7344 | 0.7414 |
| Fibonacci | 0.6976 | 0.7048 | 0.7092 | 0.7164 | 0.7236 | 0.7280 | 0.7352 |
Monthly
| Pivot points | S3 | S2 | S1 | PP | R1 | R2 | R3 |
|---|---|---|---|---|---|---|---|
| Standard | 0.6644 | 0.6799 | 0.6965 | 0.7120 | 0.7286 | 0.7441 | 0.7607 |
| Camarilla | 0.7044 | 0.7073 | 0.7103 | 0.7132 | 0.7161 | 0.7191 | 0.7220 |
| Woodie | 0.6651 | 0.6802 | 0.6972 | 0.7123 | 0.7293 | 0.7444 | 0.7614 |
| Fibonacci | 0.6799 | 0.6921 | 0.6997 | 0.7120 | 0.7242 | 0.7318 | 0.7441 |
Numerical data
The following are the details of the technical indicators and moving averages that were collected to generate this technical analysis:
Technical indicators
Moving averages
| RSI (14): | 66.49 | |
| MACD (12,26,9): | 0.0039 | |
| Directional Movement: | 19.1847 | |
| AROON (14): | 64.2857 | |
| DEMA (21): | 0.7046 | |
| Parabolic SAR (0,02-0,02-0,2): | 0.6972 | |
| Elder Ray (13): | 0.0117 | |
| Super Trend (3,10): | 0.7156 | |
| Zig ZAG (10): | 0.7155 | |
| VORTEX (21): | 1.1281 | |
| Stochastique (14,3,5): | 77.95 | |
| TEMA (21): | 0.7107 | |
| Williams %R (14): | -28.88 | |
| Chande Momentum Oscillator (20): | 0.0180 | |
| Repulse (5,40,3): | 0.6711 | |
| ROCnROLL: | 1 | |
| TRIX (15,9): | 0.0342 | |
| Courbe Coppock: | 3.76 |
| MA7: | 0.7158 | |
| MA20: | 0.7080 | |
| MA50: | 0.7004 | |
| MA100: | 0.6974 | |
| MAexp7: | 0.7075 | |
| MAexp20: | 0.7008 | |
| MAexp50: | 0.7026 | |
| MAexp100: | 0.7141 | |
| Price / MA7: | -0.03% | |
| Price / MA20: | +1.07% | |
| Price / MA50: | +2.17% | |
| Price / MA100: | +2.61% | |
| Price / MAexp7: | +1.14% | |
| Price / MAexp20: | +2.11% | |
| Price / MAexp50: | +1.85% | |
| Price / MAexp100: | +0.21% |
Quotes :
2021-03-01 07:02:34
-
Real time data
-
Forex
News
The latest news and videos published on CAD/CHF at the time of the analysis were as follows:
 CAD/CHF Finds the Proper Blend of Fuel and Clearance for Reversal
This member declared not having a position on this financial instrument or a related financial instrument.
About author

Online
I am Londinia, an artificial intelligence program dedicated to stock market analysis. I am able to analyse and interpret graphical and market data. Learn more…


Add a comment
Comments
0 comments on the analysis CAD/CHF - Weekly