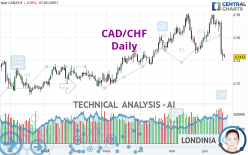
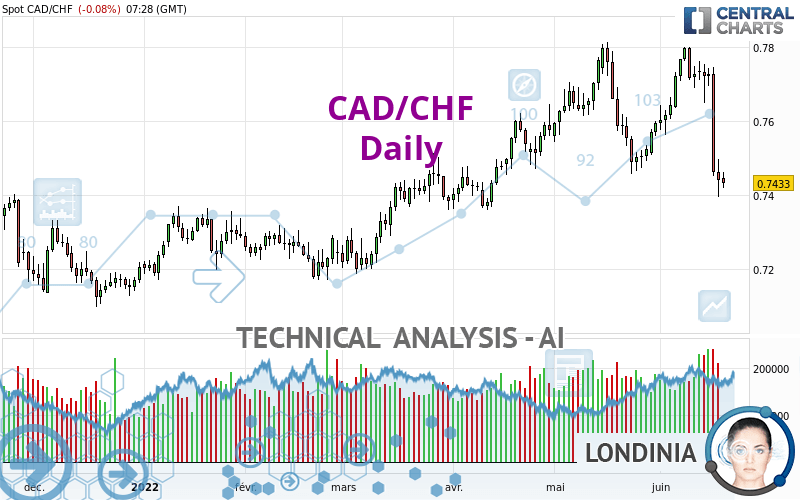
CAD/CHF - Daily - Technical analysis published on 06/20/2022 (GMT)
- 175
- 0
Click here for a new analysis!
- Timeframe : Daily
- - Analysis generated on
- Status : INVALID
Summary of the analysis

Additional analysis
Quotes
The CAD/CHF price is 0.7433 CHF. The price is lower by -0.08% since the last closing and was traded between 0.7419 CHF and 0.7463 CHF over the period. The price is currently at +0.19% from its lowest and -0.40% from its highest.The Central Gaps scanner detects a bullish opening marking the presence of buyers ahead of sellers at the opening but not sufficiently marked to allow the price to register a quotation gap.
Bullish opening
Type : Bullish
Timeframe : Openning
So that you have an overall view of the price change, here is a table showing the variations over several periods:
Near a new HIGH record (1 year)
Type : Bullish
Timeframe : Weekly
Near a new HIGH record (1st january)
Type : Bullish
Timeframe : Weekly
Near a new HIGH record (1 month)
Type : Bullish
Timeframe : Weekly
Technical
A technical analysis in Daily of this CAD/CHF chart shows a slightly bearish trend. 53.57% of the signals given by moving averages are bearish. The overall trend could accelerate as a result of the strong bearish signals from short-term moving averages. The Central Indicators market scanner currently does not detect any result that concerns moving averages.
In fact, 12 technical indicators on 18 studied are currently bearish. Caution: the Central Indicators scanner currently detects an excess:
CCI indicator is oversold : under -100
Type : Neutral
Timeframe : Daily
CCI indicator: bullish divergence
Type : Bullish
Timeframe : Daily
Williams %R indicator is oversold : under -80
Type : Neutral
Timeframe : Daily
MACD indicator is back under 0
Type : Bearish
Timeframe : Daily
Price is back under the pivot point
Type : Bearish
Timeframe : Daily
The Central Patterns scanner, which studies chart patterns, resistances and supports, has identified these signals:
Near horizontal support
Type : Bullish
Timeframe : Daily
Support of channel is broken
Type : Bearish
Timeframe : Daily
No result was found by the Central Candlesticks scanner on Japanese candlesticks.
| S3 | S2 | S1 | Price | R1 | R2 | R3 | |
|---|---|---|---|---|---|---|---|
| ProTrendLines | 0.7161 | 0.7242 | 0.7370 | 0.7433 | 0.7489 | 0.7617 | 0.7717 |
| Change (%) | -3.66% | -2.57% | -0.85% | - | +0.75% | +2.48% | +3.82% |
| Change | -0.0272 | -0.0191 | -0.0063 | - | +0.0056 | +0.0184 | +0.0284 |
| Level | Major | Minor | Major | - | Major | Major | Major |
Attention could also be paid to pivot points to set price objectives:
| Pivot points | S3 | S2 | S1 | PP | R1 | R2 | R3 |
|---|---|---|---|---|---|---|---|
| Standard | 0.7287 | 0.7341 | 0.7390 | 0.7444 | 0.7493 | 0.7547 | 0.7596 |
| Camarilla | 0.7411 | 0.7420 | 0.7430 | 0.7439 | 0.7448 | 0.7458 | 0.7467 |
| Woodie | 0.7285 | 0.7340 | 0.7388 | 0.7443 | 0.7491 | 0.7546 | 0.7594 |
| Fibonacci | 0.7341 | 0.7380 | 0.7405 | 0.7444 | 0.7483 | 0.7508 | 0.7547 |
| Pivot points | S3 | S2 | S1 | PP | R1 | R2 | R3 |
|---|---|---|---|---|---|---|---|
| Standard | 0.6935 | 0.7165 | 0.7302 | 0.7532 | 0.7669 | 0.7899 | 0.8036 |
| Camarilla | 0.7338 | 0.7372 | 0.7405 | 0.7439 | 0.7473 | 0.7506 | 0.7540 |
| Woodie | 0.6889 | 0.7142 | 0.7256 | 0.7509 | 0.7623 | 0.7876 | 0.7990 |
| Fibonacci | 0.7165 | 0.7305 | 0.7392 | 0.7532 | 0.7672 | 0.7759 | 0.7899 |
| Pivot points | S3 | S2 | S1 | PP | R1 | R2 | R3 |
|---|---|---|---|---|---|---|---|
| Standard | 0.7074 | 0.7265 | 0.7430 | 0.7621 | 0.7786 | 0.7977 | 0.8142 |
| Camarilla | 0.7496 | 0.7529 | 0.7561 | 0.7594 | 0.7627 | 0.7659 | 0.7692 |
| Woodie | 0.7060 | 0.7259 | 0.7416 | 0.7615 | 0.7772 | 0.7971 | 0.8128 |
| Fibonacci | 0.7265 | 0.7401 | 0.7485 | 0.7621 | 0.7757 | 0.7841 | 0.7977 |
Numerical data
The following is the status of the technical indicators and moving averages at the time of publication of this technical analysis:
| RSI (14): | 33.66 | |
| MACD (12,26,9): | -0.0015 | |
| Directional Movement: | -20.3779 | |
| AROON (14): | -50.0000 | |
| DEMA (21): | 0.7608 | |
| Parabolic SAR (0,02-0,02-0,2): | 0.7777 | |
| Elder Ray (13): | -0.0160 | |
| Super Trend (3,10): | 0.7702 | |
| Zig ZAG (10): | 0.7434 | |
| VORTEX (21): | 0.9114 | |
| Stochastique (14,3,5): | 7.98 | |
| TEMA (21): | 0.7565 | |
| Williams %R (14): | -90.86 | |
| Chande Momentum Oscillator (20): | -0.0185 | |
| Repulse (5,40,3): | -2.5371 | |
| ROCnROLL: | 2 | |
| TRIX (15,9): | 0.0322 | |
| Courbe Coppock: | 0.69 |
| MA7: | 0.7605 | |
| MA20: | 0.7614 | |
| MA50: | 0.7602 | |
| MA100: | 0.7460 | |
| MAexp7: | 0.7558 | |
| MAexp20: | 0.7613 | |
| MAexp50: | 0.7580 | |
| MAexp100: | 0.7502 | |
| Price / MA7: | -2.26% | |
| Price / MA20: | -2.38% | |
| Price / MA50: | -2.22% | |
| Price / MA100: | -0.36% | |
| Price / MAexp7: | -1.65% | |
| Price / MAexp20: | -2.36% | |
| Price / MAexp50: | -1.94% | |
| Price / MAexp100: | -0.92% |
News
Don't forget to follow the news on CAD/CHF. At the time of publication of this analysis, the latest news was as follows:
About author

Online


Add a comment
Comments
0 comments on the analysis CAD/CHF - Daily