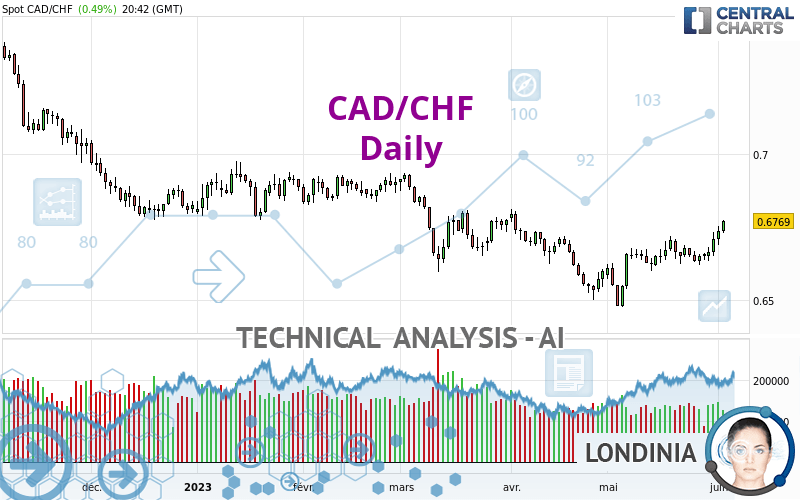
CAD/CHF - Daily - Technical analysis published on 06/02/2023 (GMT)
- 159
- 0
Click here for a new analysis!
- Timeframe : Daily
- - Analysis generated on
- Status : LEVEL MAINTAINED

Summary of the analysis

Additional analysis
Quotes
The CAD/CHF price is 0.6769 CHF. The price registered an increase of +0.49% on the session and was between 0.6729 CHF and 0.6773 CHF. This implies that the price is at +0.59% from its lowest and at -0.06% from its highest.So that you have an overall view of the price change, here is a table showing the variations over several periods:
Near a new LOW record (5 years)
Type : Bearish
Timeframe : Weekly
Near a new LOW record (1 year)
Type : Bearish
Timeframe : Weekly
Near a new LOW record (1st january)
Type : Bearish
Timeframe : Weekly
New HIGH record (1 month)
Type : Bullish
Timeframe : Weekly
Technical
Technical analysis of CAD/CHF in Daily shows an overall bullish trend. 64.29% of the signals given by moving averages are bullish. The overall trend is reinforced by the strong bullish signals from short-term moving averages. The Central Indicators market scanner is currently detecting several bullish signals that could impact this trend:
Moving Average bullish crossovers : MA20 & MA50
Type : Bullish
Timeframe : Daily
Bullish price crossover with Moving Average 100
Type : Bullish
Timeframe : Daily
An assessment of technical indicators shows a strong bullish signal.
But beware of excesses. The Central Indicators scanner currently detects this:
CCI indicator is overbought : over 100
Type : Neutral
Timeframe : Daily
Williams %R indicator is overbought : over -20
Type : Neutral
Timeframe : Daily
Pivot points : price is over resistance 1
Type : Neutral
Timeframe : Daily
Pivot points : price is over resistance 3
Type : Neutral
Timeframe : Weekly
An analysis of the price chart with the Central Patterns scanner (detector of chart patterns and resistances and supports) shows several results that can have an impact on the price change:
Near horizontal resistance
Type : Bearish
Timeframe : Daily
Resistance of channel is broken
Type : Bullish
Timeframe : Daily
No result was found by the Central Candlesticks scanner on Japanese candlesticks.
| S2 | S1 | Price | R1 | R2 | R3 | |
|---|---|---|---|---|---|---|
| ProTrendLines | 0.6481 | 0.6692 | 0.6769 | 0.6791 | 0.6927 | 0.7148 |
| Change (%) | -4.25% | -1.14% | - | +0.33% | +2.33% | +5.60% |
| Change | -0.0288 | -0.0077 | - | +0.0022 | +0.0158 | +0.0379 |
| Level | Minor | Major | - | Intermediate | Major | Major |
Attention could also be paid to pivot points to set price objectives:
| Pivot points | S3 | S2 | S1 | PP | R1 | R2 | R3 |
|---|---|---|---|---|---|---|---|
| Standard | 0.6634 | 0.6661 | 0.6699 | 0.6726 | 0.6764 | 0.6791 | 0.6829 |
| Camarilla | 0.6718 | 0.6724 | 0.6730 | 0.6736 | 0.6742 | 0.6748 | 0.6754 |
| Woodie | 0.6639 | 0.6664 | 0.6704 | 0.6729 | 0.6769 | 0.6794 | 0.6834 |
| Fibonacci | 0.6661 | 0.6686 | 0.6702 | 0.6726 | 0.6751 | 0.6767 | 0.6791 |
| Pivot points | S3 | S2 | S1 | PP | R1 | R2 | R3 |
|---|---|---|---|---|---|---|---|
| Standard | 0.6550 | 0.6585 | 0.6618 | 0.6653 | 0.6686 | 0.6721 | 0.6754 |
| Camarilla | 0.6633 | 0.6640 | 0.6646 | 0.6652 | 0.6658 | 0.6665 | 0.6671 |
| Woodie | 0.6550 | 0.6585 | 0.6618 | 0.6653 | 0.6686 | 0.6721 | 0.6754 |
| Fibonacci | 0.6585 | 0.6611 | 0.6627 | 0.6653 | 0.6679 | 0.6695 | 0.6721 |
| Pivot points | S3 | S2 | S1 | PP | R1 | R2 | R3 |
|---|---|---|---|---|---|---|---|
| Standard | 0.6291 | 0.6383 | 0.6546 | 0.6638 | 0.6801 | 0.6893 | 0.7056 |
| Camarilla | 0.6638 | 0.6661 | 0.6685 | 0.6708 | 0.6731 | 0.6755 | 0.6778 |
| Woodie | 0.6326 | 0.6401 | 0.6581 | 0.6656 | 0.6836 | 0.6911 | 0.7091 |
| Fibonacci | 0.6383 | 0.6481 | 0.6541 | 0.6638 | 0.6736 | 0.6796 | 0.6893 |
Numerical data
The following are the details of the technical indicators and moving averages that were collected to generate this technical analysis:
| RSI (14): | 65.27 | |
| MACD (12,26,9): | 0.0019 | |
| Directional Movement: | 12.4660 | |
| AROON (14): | 100.0000 | |
| DEMA (21): | 0.6690 | |
| Parabolic SAR (0,02-0,02-0,2): | 0.6648 | |
| Elder Ray (13): | 0.0067 | |
| Super Trend (3,10): | 0.6601 | |
| Zig ZAG (10): | 0.6770 | |
| VORTEX (21): | 1.2428 | |
| Stochastique (14,3,5): | 89.21 | |
| TEMA (21): | 0.6721 | |
| Williams %R (14): | -2.60 | |
| Chande Momentum Oscillator (20): | 0.0097 | |
| Repulse (5,40,3): | 1.4827 | |
| ROCnROLL: | 1 | |
| TRIX (15,9): | 0.0153 | |
| Courbe Coppock: | 1.55 |
| MA7: | 0.6687 | |
| MA20: | 0.6667 | |
| MA50: | 0.6663 | |
| MA100: | 0.6752 | |
| MAexp7: | 0.6706 | |
| MAexp20: | 0.6672 | |
| MAexp50: | 0.6682 | |
| MAexp100: | 0.6757 | |
| Price / MA7: | +1.23% | |
| Price / MA20: | +1.53% | |
| Price / MA50: | +1.59% | |
| Price / MA100: | +0.25% | |
| Price / MAexp7: | +0.94% | |
| Price / MAexp20: | +1.45% | |
| Price / MAexp50: | +1.30% | |
| Price / MAexp100: | +0.18% |
News
Don't forget to follow the news on CAD/CHF. At the time of publication of this analysis, the latest news was as follows:
About author

Online


Add a comment
Comments
0 comments on the analysis CAD/CHF - Daily