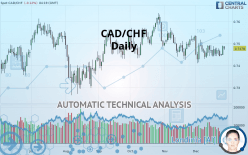
CAD/CHF - Daily - Technical analysis published on 12/27/2019 (GMT)
- Who voted?
- 270
- 0
- Timeframe : Daily
- - Analysis generated on
- Status : NEUTRAL

Summary of the analysis

Additional analysis
Quotes
The CAD/CHF rating is 0.7478 CHF. The price is lower by -0.12% since the last closing and was traded between 0.7471 CHF and 0.7487 CHF over the period. The price is currently at +0.09% from its lowest and -0.12% from its highest.The Central Gaps scanner detects a bearish opening marking the presence of sellers ahead of buyers at the opening but not sufficiently marked to allow the price to register a quotation gap.
Bearish opening
Type : Bearish
Timeframe : Openning
Here is a more detailed summary of the historical variations registered by CAD/CHF:
Technical
Technical analysis of CAD/CHF in Daily shows an overall slightly bearish trend. 57.14% of the signals given by moving averages are bearish. As the signals currently given by short-term moving averages are rather neutral, the slightly bearish trend could return to neutral. The Central Indicators market scanner is currently detecting several bullish signals that could impact this trend:
Bullish trend reversal : adaptative moving average 20
Type : Bullish
Timeframe : Daily
Bullish price crossover with Moving Average 20
Type : Bullish
Timeframe : Daily
Bullish price crossover with Moving Average 100
Type : Bullish
Timeframe : Daily
Bullish price crossover with adaptative moving average 20
Type : Bullish
Timeframe : Daily
Bullish price crossover with adaptative moving average 100
Type : Bullish
Timeframe : Daily
In fact, according to the parameters integrated into the Central Analyzer system, 12 technical indicators out of 18 analysed are currently bullish. Caution: the Central Indicators scanner currently detects an excess:
Williams %R indicator is overbought : over -20
Type : Neutral
Timeframe : Daily
RSI indicator is back over 50
Type : Bullish
Timeframe : Daily
MACD crosses UP its Moving Average
Type : Bullish
Timeframe : Daily
Parabolic SAR indicator bullish reversal
Type : Bullish
Timeframe : Daily
Aroon indicator bearish trend
Type : Bearish
Timeframe : Daily
Price is back over the pivot point
Type : Bullish
Timeframe : Daily
Price is back over the pivot point
Type : Bullish
Timeframe : Weekly
Momentum indicator is back over 0
Type : Bullish
Timeframe : Daily
Williams %R indicator is back over -50
Type : Bullish
Timeframe : Daily
An analysis of the price chart with the Central Patterns scanner (detector of chart patterns and resistances and supports) shows several results that can have an impact on the price change:
Near horizontal resistance
Type : Bearish
Timeframe : Daily
Resistance of channel is broken
Type : Bullish
Timeframe : Daily
Resistance of triangle is broken
Type : Bullish
Timeframe : Daily
The Central Candlesticks scanner, specialised in Japanese candlesticks, did not identify any signals.
| S3 | S2 | S1 | Price | R1 | R2 | R3 | |
|---|---|---|---|---|---|---|---|
| ProTrendLines | 0.7313 | 0.7373 | 0.7423 | 0.7478 | 0.7490 | 0.7526 | 0.7561 |
| Change (%) | -2.21% | -1.40% | -0.74% | - | +0.16% | +0.64% | +1.11% |
| Change | -0.0165 | -0.0105 | -0.0055 | - | +0.0012 | +0.0048 | +0.0083 |
| Level | Major | Minor | Intermediate | - | Major | Intermediate | Minor |
To determine price objectives, it is also possible to use the pivot points. Here is the price position in relation to pivot points:
| Pivot points | S3 | S2 | S1 | PP | R1 | R2 | R3 |
|---|---|---|---|---|---|---|---|
| Standard | 0.7418 | 0.7433 | 0.7460 | 0.7475 | 0.7502 | 0.7517 | 0.7544 |
| Camarilla | 0.7476 | 0.7479 | 0.7483 | 0.7487 | 0.7491 | 0.7495 | 0.7499 |
| Woodie | 0.7424 | 0.7436 | 0.7466 | 0.7478 | 0.7508 | 0.7520 | 0.7550 |
| Fibonacci | 0.7433 | 0.7449 | 0.7459 | 0.7475 | 0.7491 | 0.7501 | 0.7517 |
| Pivot points | S3 | S2 | S1 | PP | R1 | R2 | R3 |
|---|---|---|---|---|---|---|---|
| Standard | 0.7390 | 0.7416 | 0.7442 | 0.7468 | 0.7494 | 0.7520 | 0.7546 |
| Camarilla | 0.7455 | 0.7460 | 0.7464 | 0.7469 | 0.7474 | 0.7479 | 0.7483 |
| Woodie | 0.7391 | 0.7416 | 0.7443 | 0.7468 | 0.7495 | 0.7520 | 0.7547 |
| Fibonacci | 0.7416 | 0.7436 | 0.7448 | 0.7468 | 0.7488 | 0.7500 | 0.7520 |
| Pivot points | S3 | S2 | S1 | PP | R1 | R2 | R3 |
|---|---|---|---|---|---|---|---|
| Standard | 0.7300 | 0.7362 | 0.7446 | 0.7508 | 0.7592 | 0.7654 | 0.7738 |
| Camarilla | 0.7489 | 0.7502 | 0.7516 | 0.7529 | 0.7542 | 0.7556 | 0.7569 |
| Woodie | 0.7310 | 0.7368 | 0.7456 | 0.7514 | 0.7602 | 0.7660 | 0.7748 |
| Fibonacci | 0.7362 | 0.7418 | 0.7453 | 0.7508 | 0.7564 | 0.7599 | 0.7654 |
Numerical data
The following are the details of the technical indicators and moving averages that were collected to generate this technical analysis:
| RSI (14): | 50.39 | |
| MACD (12,26,9): | -0.0007 | |
| Directional Movement: | 0.0165 | |
| AROON (14): | -14.2857 | |
| DEMA (21): | 0.7462 | |
| Parabolic SAR (0,02-0,02-0,2): | 0.7412 | |
| Elder Ray (13): | 0.0010 | |
| Super Trend (3,10): | 0.7561 | |
| Zig ZAG (10): | 0.7478 | |
| VORTEX (21): | 0.9466 | |
| Stochastique (14,3,5): | 54.67 | |
| TEMA (21): | 0.7463 | |
| Williams %R (14): | -23.81 | |
| Chande Momentum Oscillator (20): | 0.0040 | |
| Repulse (5,40,3): | 0.2137 | |
| ROCnROLL: | -1 | |
| TRIX (15,9): | -0.0192 | |
| Courbe Coppock: | 0.19 |
| MA7: | 0.7467 | |
| MA20: | 0.7468 | |
| MA50: | 0.7499 | |
| MA100: | 0.7475 | |
| MAexp7: | 0.7469 | |
| MAexp20: | 0.7472 | |
| MAexp50: | 0.7483 | |
| MAexp100: | 0.7485 | |
| Price / MA7: | +0.15% | |
| Price / MA20: | +0.13% | |
| Price / MA50: | -0.28% | |
| Price / MA100: | +0.04% | |
| Price / MAexp7: | +0.12% | |
| Price / MAexp20: | +0.08% | |
| Price / MAexp50: | -0.07% | |
| Price / MAexp100: | -0.09% |
News
The latest news and videos published on CAD/CHF at the time of the analysis were as follows:
 CAD/CHF Finds the Proper Blend of Fuel and Clearance for Reversal
About author

Online


Add a comment
Comments
0 comments on the analysis CAD/CHF - Daily