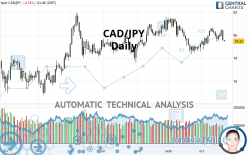
CAD/JPY - Daily - Technical analysis published on 10/22/2020 (GMT)
- 175
- 0
Click here for a new analysis!
- Timeframe : Daily
- - Analysis generated on
- Status : TARGET REACHED

Summary of the analysis

Additional analysis
Quotes
The CAD/JPY rating is 79.47 JPY. The price registered a decrease of -0.14% on the session and was traded between 79.45 JPY and 79.59 JPY over the period. The price is currently at +0.03% from its lowest and -0.15% from its highest.A study of price movements over other periods shows the following variations:
Technical
Technical analysis of this Daily chart of CAD/JPY indicates that the overall trend is bearish. The signals given by moving averages are at 71.43% bearish. This bearish trend shows slight signs of slowing down given the slightly bearish signals of short-term moving averages. An assessment of moving averages reveals several bearish signals that could impact this trend:
Bearish trend reversal : Moving Average 50
Type : Bearish
Timeframe : Daily
Bearish trend reversal : adaptative moving average 20
Type : Bearish
Timeframe : Daily
Bearish trend reversal : adaptative moving average 50
Type : Bearish
Timeframe : Daily
Bearish trend reversal : adaptative moving average 100
Type : Bearish
Timeframe : Daily
Bearish price crossover with Moving Average 20
Type : Bearish
Timeframe : Daily
Bearish price crossover with Moving Average 50
Type : Bearish
Timeframe : Daily
Bearish price crossover with Moving Average 100
Type : Bearish
Timeframe : Daily
Bearish price crossover with adaptative moving average 20
Type : Bearish
Timeframe : Daily
An assessment of technical indicators does not currently provide any relevant information to suggest whether the signal given by the technical indicators is more bullish or bearish.
Caution: the Central Indicators scanner currently detects an excess:
MACD indicator: bearish divergence
Type : Bearish
Timeframe : Daily
RSI indicator is back under 50
Type : Bearish
Timeframe : Daily
Ichimoku : price is under the cloud
Type : Bearish
Timeframe : Daily
Price is back under the pivot point
Type : Bearish
Timeframe : Daily
Price is back under the pivot point
Type : Bearish
Timeframe : Weekly
Momentum indicator is back under 0
Type : Bearish
Timeframe : Daily
Williams %R indicator is back under -50
Type : Bearish
Timeframe : Daily
An analysis of the price chart with the Central Patterns scanner (detector of chart patterns and resistances and supports) shows a result that can have an impact on the price change:
Near resistance of triangle
Type : Bearish
Timeframe : Daily
The Central Candlesticks scanner, specialised in Japanese candlesticks, did not identify any signals.
| S3 | S2 | S1 | Price | R1 | R2 | R3 | |
|---|---|---|---|---|---|---|---|
| ProTrendLines | 76.90 | 78.04 | 79.34 | 79.47 | 80.85 | 81.66 | 82.75 |
| Change (%) | -3.23% | -1.80% | -0.16% | - | +1.74% | +2.76% | +4.13% |
| Change | -2.57 | -1.43 | -0.13 | - | +1.38 | +2.19 | +3.28 |
| Level | Minor | Intermediate | Major | - | Major | Major | Minor |
Pivot points can also be used to set your price objectives. Here is the price situation in relation to pivot points:
| Pivot points | S3 | S2 | S1 | PP | R1 | R2 | R3 |
|---|---|---|---|---|---|---|---|
| Standard | 78.25 | 78.87 | 79.23 | 79.85 | 80.21 | 80.83 | 81.19 |
| Camarilla | 79.31 | 79.40 | 79.49 | 79.58 | 79.67 | 79.76 | 79.85 |
| Woodie | 78.11 | 78.81 | 79.09 | 79.79 | 80.07 | 80.77 | 81.05 |
| Fibonacci | 78.87 | 79.25 | 79.48 | 79.85 | 80.23 | 80.46 | 80.83 |
| Pivot points | S3 | S2 | S1 | PP | R1 | R2 | R3 |
|---|---|---|---|---|---|---|---|
| Standard | 78.13 | 78.79 | 79.34 | 80.00 | 80.55 | 81.21 | 81.76 |
| Camarilla | 79.57 | 79.68 | 79.79 | 79.90 | 80.01 | 80.12 | 80.23 |
| Woodie | 78.09 | 78.76 | 79.30 | 79.97 | 80.51 | 81.18 | 81.72 |
| Fibonacci | 78.79 | 79.25 | 79.53 | 80.00 | 80.46 | 80.74 | 81.21 |
| Pivot points | S3 | S2 | S1 | PP | R1 | R2 | R3 |
|---|---|---|---|---|---|---|---|
| Standard | 74.81 | 76.59 | 77.91 | 79.69 | 81.01 | 82.79 | 84.11 |
| Camarilla | 78.38 | 78.66 | 78.95 | 79.23 | 79.51 | 79.80 | 80.08 |
| Woodie | 74.58 | 76.48 | 77.68 | 79.58 | 80.78 | 82.68 | 83.88 |
| Fibonacci | 76.59 | 77.77 | 78.51 | 79.69 | 80.87 | 81.61 | 82.79 |
Numerical data
The following are the details of the technical indicators and moving averages that were collected to generate this technical analysis:
| RSI (14): | 46.07 | |
| MACD (12,26,9): | 0.0200 | |
| Directional Movement: | -4.96 | |
| AROON (14): | 42.86 | |
| DEMA (21): | 79.82 | |
| Parabolic SAR (0,02-0,02-0,2): | 80.53 | |
| Elder Ray (13): | -0.31 | |
| Super Trend (3,10): | 80.55 | |
| Zig ZAG (10): | 79.45 | |
| VORTEX (21): | 1.0800 | |
| Stochastique (14,3,5): | 51.13 | |
| TEMA (21): | 79.88 | |
| Williams %R (14): | -76.47 | |
| Chande Momentum Oscillator (20): | 0.18 | |
| Repulse (5,40,3): | -0.7700 | |
| ROCnROLL: | 2 | |
| TRIX (15,9): | 0.0000 | |
| Courbe Coppock: | 1.62 |
| MA7: | 79.84 | |
| MA20: | 79.69 | |
| MA50: | 80.03 | |
| MA100: | 79.63 | |
| MAexp7: | 79.82 | |
| MAexp20: | 79.81 | |
| MAexp50: | 79.77 | |
| MAexp100: | 79.61 | |
| Price / MA7: | -0.46% | |
| Price / MA20: | -0.28% | |
| Price / MA50: | -0.70% | |
| Price / MA100: | -0.20% | |
| Price / MAexp7: | -0.44% | |
| Price / MAexp20: | -0.43% | |
| Price / MAexp50: | -0.38% | |
| Price / MAexp100: | -0.18% |
News
The latest news and videos published on CAD/JPY at the time of the analysis were as follows:
-
 Quick Takes Video: BoC Hike Pushes CAD/JPY To Key Resistance, Now What?
-
Forex: Top FX Headlines: GBP/USD Awaits Catalyst; USD/CAD, CAD/JPY at Crossroads: 7/11/17
-
Technical Focus: CAD/JPY - Getting Ready for the Next Big Level
-
Forex: Top FX Headlines: USD/CAD, CAD/JPY in the Spotlight Today - Watch Crude Oil Price: 2/24/17
-
Harmony Stalking an Opportunity on CAD/JPY
About author

Online


Add a comment
Comments
0 comments on the analysis CAD/JPY - Daily