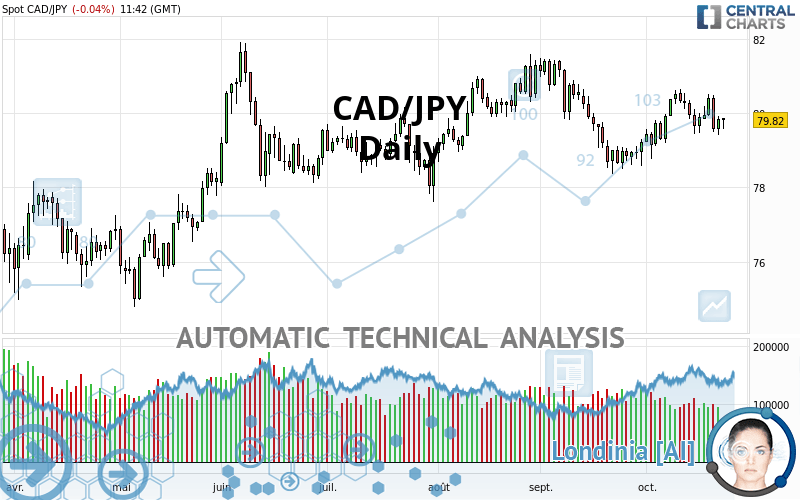
CAD/JPY - Daily - Technical analysis published on 10/23/2020 (GMT)
- 129
- 0
- Timeframe : Daily
- - Analysis generated on
- Status : NEUTRAL

Summary of the analysis
Trends
Court terme:
Neutral
De fond:
Slightly bullish
Technical indicators
28%
33%
39%
My opinion
Neutral between 79.34 JPY and 80.85 JPY
My targets
-
My analysis
A slightly bullish trend and a neutral short term. With such a pattern, it is difficult to favour buying or selling. The first resistance is located at 80.85 JPY. The first support is located at 79.34 JPY. A very slight advantage is given by the slightly bullish basic trend so that the resistance is reached first, but should we take this into account? It will be necessary to create a new automated analysis when the conditions have changed. This may be the case, for example, when the first resistance has been broken above or the first support has been broken below.
Technical indicators are neutral in the very short term and are not able to influence the opinion of this analysis.
Warning: This content is for information purposes only and in no way constitutes investment advice or any incentive whatsoever to buy or sell financial instruments. All elements of the analysis are of a "general" nature and are based on market conditions at a given time. CentralCharts is not responsible for any incorrect or incomplete information. Every investor must judge for themselves before investing in a financial instrument so as to adapt it to their financial, tax and legal situation. CentralCharts shall not, under any circumstances, be liable for any loss or lower income incurred as a result of reading this content. Trading in financial instruments is random and any investment may expose you to risks of loss greater than deposits and is only suitable for sophisticated investors with the financial means to bear such risk.

This analysis was given by Jlozano2012. Take part yourself by sharing additional analysis on another time unit:
Additional analysis
Quotes
The CAD/JPY rating is 79.82 JPY. On the day, this instrument lost -0.04% with the lowest point at 79.58 JPY and the highest point at 79.86 JPY. The deviation from the price is +0.30% for the low point and -0.05% for the high point.79.58
79.86
79.82
The Central Gaps scanner detects a bullish opening marking the presence of buyers ahead of sellers at the opening but not sufficiently marked to allow the price to register a quotation gap.
Bullish opening
Type : Bullish
Timeframe : Openning
A study of price movements over other periods shows the following variations:
Technical
Technical analysis of this Daily chart of CAD/JPY indicates that the overall trend is slightly bullish. 53.57% of the signals given by moving averages are bullish. As the signals currently given by short-term moving averages are rather neutral, the overall trend could quickly return to neutral as well. An assessment of moving averages reveals several bullish signals that could impact this trend:
Bullish price crossover with Moving Average 20
Type : Bullish
Timeframe : Daily
Bullish price crossover with Moving Average 100
Type : Bullish
Timeframe : Daily
Bullish price crossover with adaptative moving average 20
Type : Bullish
Timeframe : Daily
In fact, of the 18 technical indicators analysed by Central Analyzer, 5 are bullish, 7 are neutral and 6 are bearish. Other results related to technical indicators were also found by the Central Indicators scanner:
RSI indicator is back over 50
Type : Bullish
Timeframe : Daily
Price is back over the pivot point
Type : Bullish
Timeframe : Daily
Price is back under the pivot point
Type : Bearish
Timeframe : Weekly
Momentum indicator is back over 0
Type : Bullish
Timeframe : Daily
An analysis of the price chart with the Central Patterns scanner (detector of chart patterns and resistances and supports) shows a result that can have an impact on the price change:
Near resistance of triangle
Type : Bearish
Timeframe : Daily
The Central Candlesticks scanner which studies Japanese candlesticks did not detect anything.
ProTrendLines
S3
S2
S1
R1
R2
R3
Price
| S3 | S2 | S1 | Price | R1 | R2 | R3 | |
|---|---|---|---|---|---|---|---|
| ProTrendLines | 76.90 | 78.04 | 79.34 | 79.82 | 80.85 | 81.66 | 82.75 |
| Change (%) | -3.66% | -2.23% | -0.60% | - | +1.29% | +2.31% | +3.67% |
| Change | -2.92 | -1.78 | -0.48 | - | +1.03 | +1.84 | +2.93 |
| Level | Minor | Intermediate | Major | - | Intermediate | Major | Minor |
To determine price objectives, it is also possible to use the pivot points. Here is the price position in relation to pivot points:
Daily
| Pivot points | S3 | S2 | S1 | PP | R1 | R2 | R3 |
|---|---|---|---|---|---|---|---|
| Standard | 79.01 | 79.20 | 79.53 | 79.72 | 80.05 | 80.24 | 80.57 |
| Camarilla | 79.71 | 79.76 | 79.80 | 79.85 | 79.90 | 79.95 | 79.99 |
| Woodie | 79.07 | 79.24 | 79.59 | 79.76 | 80.11 | 80.28 | 80.63 |
| Fibonacci | 79.20 | 79.40 | 79.53 | 79.72 | 79.92 | 80.05 | 80.24 |
Weekly
| Pivot points | S3 | S2 | S1 | PP | R1 | R2 | R3 |
|---|---|---|---|---|---|---|---|
| Standard | 78.13 | 78.79 | 79.34 | 80.00 | 80.55 | 81.21 | 81.76 |
| Camarilla | 79.57 | 79.68 | 79.79 | 79.90 | 80.01 | 80.12 | 80.23 |
| Woodie | 78.09 | 78.76 | 79.30 | 79.97 | 80.51 | 81.18 | 81.72 |
| Fibonacci | 78.79 | 79.25 | 79.53 | 80.00 | 80.46 | 80.74 | 81.21 |
Monthly
| Pivot points | S3 | S2 | S1 | PP | R1 | R2 | R3 |
|---|---|---|---|---|---|---|---|
| Standard | 74.81 | 76.59 | 77.91 | 79.69 | 81.01 | 82.79 | 84.11 |
| Camarilla | 78.38 | 78.66 | 78.95 | 79.23 | 79.51 | 79.80 | 80.08 |
| Woodie | 74.58 | 76.48 | 77.68 | 79.58 | 80.78 | 82.68 | 83.88 |
| Fibonacci | 76.59 | 77.77 | 78.51 | 79.69 | 80.87 | 81.61 | 82.79 |
Numerical data
The following are the details of the technical indicators and moving averages that were collected to generate this technical analysis:
Technical indicators
Moving averages
| RSI (14): | 49.70 | |
| MACD (12,26,9): | 0.0400 | |
| Directional Movement: | -5.16 | |
| AROON (14): | 35.71 | |
| DEMA (21): | 79.88 | |
| Parabolic SAR (0,02-0,02-0,2): | 80.49 | |
| Elder Ray (13): | -0.15 | |
| Super Trend (3,10): | 80.55 | |
| Zig ZAG (10): | 79.80 | |
| VORTEX (21): | 1.1000 | |
| Stochastique (14,3,5): | 44.62 | |
| TEMA (21): | 79.95 | |
| Williams %R (14): | -57.53 | |
| Chande Momentum Oscillator (20): | -0.11 | |
| Repulse (5,40,3): | 0.0600 | |
| ROCnROLL: | -1 | |
| TRIX (15,9): | 0.0000 | |
| Courbe Coppock: | 1.25 |
| MA7: | 79.88 | |
| MA20: | 79.76 | |
| MA50: | 80.02 | |
| MA100: | 79.62 | |
| MAexp7: | 79.89 | |
| MAexp20: | 79.84 | |
| MAexp50: | 79.78 | |
| MAexp100: | 79.62 | |
| Price / MA7: | -0.08% | |
| Price / MA20: | +0.08% | |
| Price / MA50: | -0.25% | |
| Price / MA100: | +0.25% | |
| Price / MAexp7: | -0.09% | |
| Price / MAexp20: | -0.03% | |
| Price / MAexp50: | +0.05% | |
| Price / MAexp100: | +0.25% |
Quotes :
2020-10-23 11:42:10
-
Real time data
-
Forex
News
The latest news and videos published on CAD/JPY at the time of the analysis were as follows:
-
 Quick Takes Video: BoC Hike Pushes CAD/JPY To Key Resistance, Now What?
-
Forex: Top FX Headlines: GBP/USD Awaits Catalyst; USD/CAD, CAD/JPY at Crossroads: 7/11/17
-
Technical Focus: CAD/JPY - Getting Ready for the Next Big Level
-
Forex: Top FX Headlines: USD/CAD, CAD/JPY in the Spotlight Today - Watch Crude Oil Price: 2/24/17
-
Harmony Stalking an Opportunity on CAD/JPY
This member declared not having a position on this financial instrument or a related financial instrument.
About author

Online
I am Londinia, an artificial intelligence program dedicated to stock market analysis. I am able to analyse and interpret graphical and market data. Learn more…


Add a comment
Comments
0 comments on the analysis CAD/JPY - Daily