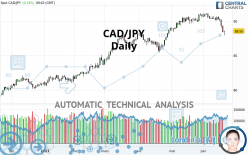
CAD/JPY - Daily - Technical analysis published on 06/21/2021 (GMT)
- 157
- 0
Click here for a new analysis!
- Timeframe : Daily
- - Analysis generated on
- Status : TARGET REACHED

Summary of the analysis

Additional analysis
Quotes
The CAD/JPY price is 88.55 JPY. The price has increased by +0.14% since the last closing with the lowest point at 87.96 JPY and the highest point at 88.64 JPY. The deviation from the price is +0.67% for the low point and -0.10% for the high point.The Central Gaps scanner detects a bullish opening marking the presence of buyers ahead of sellers at the opening but not sufficiently marked to allow the price to register a quotation gap.
Bullish opening
Type : Bullish
Timeframe : Openning
So that you have an overall view of the price change, here is a table showing the variations over several periods:
Near a new HIGH record (5 years)
Type : Bullish
Timeframe : Weekly
Near a new HIGH record (1st january)
Type : Bullish
Timeframe : Weekly
Near a new HIGH record (1 month)
Type : Bullish
Timeframe : Weekly
Technical
A technical analysis in Daily of this CAD/JPY chart shows a slightly bullish trend. 57.14% of the signals given by moving averages are bullish. Caution: a reversal of the trend could be possible given the strong bearish signals of short-term moving averages. The Central Indicators market scanner is currently detecting several bearish signals that could impact this trend:
Bearish trend reversal : adaptative moving average 50
Type : Bearish
Timeframe : Daily
Bearish price crossover with Moving Average 50
Type : Bearish
Timeframe : Daily
In fact, according to the parameters integrated into the Central Analyzer system, 14 technical indicators out of 18 analysed are currently bearish. But beware of excesses. The Central Indicators scanner currently detects this:
CCI indicator is oversold : under -100
Type : Neutral
Timeframe : Daily
Williams %R indicator is oversold : under -80
Type : Neutral
Timeframe : Daily
SuperTrend indicator bearish reversal
Type : Bearish
Timeframe : Daily
Price is back under the pivot point
Type : Bearish
Timeframe : Daily
Price is back under the pivot point
Type : Bearish
Timeframe : Weekly
An analysis of the price chart with the Central Patterns scanner (detector of chart patterns and resistances and supports) shows several results that can have an impact on the price change:
Near horizontal support
Type : Bullish
Timeframe : Daily
Support of channel is broken
Type : Bearish
Timeframe : Daily
No result was found by the Central Candlesticks scanner on Japanese candlesticks.
| S3 | S2 | S1 | Price | R1 | R2 | R3 | |
|---|---|---|---|---|---|---|---|
| ProTrendLines | 81.49 | 84.47 | 85.73 | 88.55 | 88.86 | 91.17 | 100.73 |
| Change (%) | -7.97% | -4.61% | -3.18% | - | +0.35% | +2.96% | +13.75% |
| Change | -7.06 | -4.08 | -2.82 | - | +0.31 | +2.62 | +12.18 |
| Level | Intermediate | Major | Intermediate | - | Major | Major | Minor |
To determine price objectives, it is also possible to use the pivot points. Here is the price position in relation to pivot points:
| Pivot points | S3 | S2 | S1 | PP | R1 | R2 | R3 |
|---|---|---|---|---|---|---|---|
| Standard | 87.04 | 87.69 | 88.06 | 88.71 | 89.08 | 89.73 | 90.10 |
| Camarilla | 88.15 | 88.24 | 88.34 | 88.43 | 88.52 | 88.62 | 88.71 |
| Woodie | 86.90 | 87.62 | 87.92 | 88.64 | 88.94 | 89.66 | 89.96 |
| Fibonacci | 87.69 | 88.08 | 88.32 | 88.71 | 89.10 | 89.34 | 89.73 |
| Pivot points | S3 | S2 | S1 | PP | R1 | R2 | R3 |
|---|---|---|---|---|---|---|---|
| Standard | 85.19 | 86.76 | 87.60 | 89.17 | 90.01 | 91.58 | 92.42 |
| Camarilla | 87.77 | 87.99 | 88.21 | 88.43 | 88.65 | 88.87 | 89.09 |
| Woodie | 84.82 | 86.58 | 87.23 | 88.99 | 89.64 | 91.40 | 92.05 |
| Fibonacci | 86.76 | 87.68 | 88.25 | 89.17 | 90.09 | 90.66 | 91.58 |
| Pivot points | S3 | S2 | S1 | PP | R1 | R2 | R3 |
|---|---|---|---|---|---|---|---|
| Standard | 86.34 | 87.39 | 89.08 | 90.13 | 91.82 | 92.87 | 94.56 |
| Camarilla | 90.03 | 90.28 | 90.53 | 90.78 | 91.03 | 91.28 | 91.53 |
| Woodie | 86.67 | 87.55 | 89.41 | 90.29 | 92.15 | 93.03 | 94.89 |
| Fibonacci | 87.39 | 88.43 | 89.08 | 90.13 | 91.17 | 91.82 | 92.87 |
Numerical data
The following is the status of technical indicators and moving averages registered at the time this technical analysis was created:
| RSI (14): | 34.61 | |
| MACD (12,26,9): | -0.1000 | |
| Directional Movement: | -20.66 | |
| AROON (14): | -100.00 | |
| DEMA (21): | 89.96 | |
| Parabolic SAR (0,02-0,02-0,2): | 90.75 | |
| Elder Ray (13): | -1.50 | |
| Super Trend (3,10): | 90.21 | |
| Zig ZAG (10): | 88.55 | |
| VORTEX (21): | 0.8400 | |
| Stochastique (14,3,5): | 12.65 | |
| TEMA (21): | 89.36 | |
| Williams %R (14): | -80.56 | |
| Chande Momentum Oscillator (20): | -2.50 | |
| Repulse (5,40,3): | -0.9900 | |
| ROCnROLL: | 2 | |
| TRIX (15,9): | 0.0400 | |
| Courbe Coppock: | 2.45 |
| MA7: | 89.68 | |
| MA20: | 90.29 | |
| MA50: | 89.27 | |
| MA100: | 87.32 | |
| MAexp7: | 89.42 | |
| MAexp20: | 89.91 | |
| MAexp50: | 89.21 | |
| MAexp100: | 87.50 | |
| Price / MA7: | -1.26% | |
| Price / MA20: | -1.93% | |
| Price / MA50: | -0.81% | |
| Price / MA100: | +1.41% | |
| Price / MAexp7: | -0.97% | |
| Price / MAexp20: | -1.51% | |
| Price / MAexp50: | -0.74% | |
| Price / MAexp100: | +1.20% |
News
The last news published on CAD/JPY at the time of the generation of this analysis was as follows:
-
 Quick Takes Video: BoC Hike Pushes CAD/JPY To Key Resistance, Now What?
-
Forex: Top FX Headlines: GBP/USD Awaits Catalyst; USD/CAD, CAD/JPY at Crossroads: 7/11/17
-
Technical Focus: CAD/JPY - Getting Ready for the Next Big Level
-
Forex: Top FX Headlines: USD/CAD, CAD/JPY in the Spotlight Today - Watch Crude Oil Price: 2/24/17
-
Harmony Stalking an Opportunity on CAD/JPY
About author

Online


Add a comment
Comments
0 comments on the analysis CAD/JPY - Daily