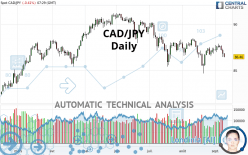
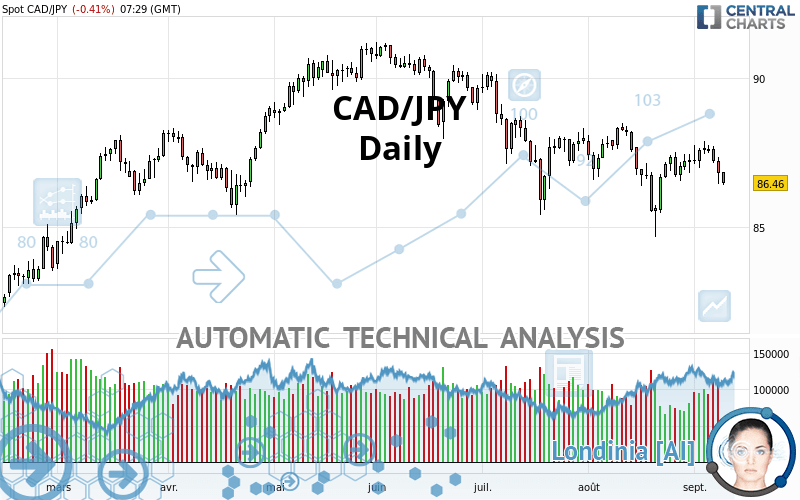
CAD/JPY - Daily - Technical analysis published on 09/09/2021 (GMT)
- 201
- 0
I am delighted to see that my first price objective has been achieved. I hope you've taken advantage of it.
Click here for a new analysis!
Click here for a new analysis!
- Timeframe : Daily
- - Analysis generated on
- Status : TARGET REACHED
Summary of the analysis
Trends
Short term:
Strongly bearish
Underlying:
Bearish
Technical indicators
28%
39%
33%
My opinion
Bearish under 86.96 JPY
My targets
85.73 JPY (-0.73)
84.47 JPY (-1.99)
My analysis
In the short term, we can see an acceleration in the bearish trend on CAD/JPY, which is a positive signal for sellers. As long as the price remains above 86.96 JPY, a sale could be considered. The first bearish objective is located at 85.73 JPY. The bearish momentum would be revived by a break in this support. Sellers would then use the next support located at 84.47 JPY as an objective. Crossing it would then enable sellers to target 83.26 JPY. If the price were to return above 86.96 JPY, it would probably only trigger a small rebound in the short term to give a better base for restarting. Trading this rebound may be risky.
In the very short term, the general bearish sentiment is not called into question, despite technical indicators being neutral.
Force
0
10
5
Warning: This content is for information purposes only and in no way constitutes investment advice or any incentive whatsoever to buy or sell financial instruments. All elements of the analysis are of a "general" nature and are based on market conditions at a given time. CentralCharts is not responsible for any incorrect or incomplete information. Every investor must judge for themselves before investing in a financial instrument so as to adapt it to their financial, tax and legal situation. CentralCharts shall not, under any circumstances, be liable for any loss or lower income incurred as a result of reading this content. Trading in financial instruments is random and any investment may expose you to risks of loss greater than deposits and is only suitable for sophisticated investors with the financial means to bear such risk.

This analysis was given by Vincent Launay. Take part yourself by sharing additional analysis on another time unit:
Additional analysis
Quotes
CAD/JPY rating 86.46 JPY. The price is lower by -0.42% since the last closing with the lowest point at 86.41 JPY and the highest point at 86.84 JPY. The deviation from the price is +0.06% for the low point and -0.44% for the high point.86.41
86.84
86.46
The Central Gaps scanner detects a bullish opening marking the presence of buyers ahead of sellers at the opening but not sufficiently marked to allow the price to register a quotation gap.
Bullish opening
Type : Bullish
Timeframe : Openning
A study of price movements over other periods shows the following variations:
Near a new HIGH record (5 years)
Type : Bullish
Timeframe : Weekly
Technical
Technical analysis of this Daily chart of CAD/JPY indicates that the overall trend is bearish. 78.57% of the signals given by moving averages are bearish. The overall trend is reinforced by the strong bearish signals from short-term moving averages. The Central Indicators market scanner is currently detecting a bearish signal that could impact this trend:
Bearish price crossover with Moving Average 20
Type : Bearish
Timeframe : Daily
The technical indicators are generally neutral. They do not provide relevant information on the direction of future price movements.
Central Indicators, the detector scanner for these technical indicators has recently detected several signals:
Pivot points : price is under support 1
Type : Neutral
Timeframe : Weekly
Price is back over the pivot point
Type : Bullish
Timeframe : Weekly
Price is back under the pivot point
Type : Bearish
Timeframe : Daily
The Central Patterns scanner, which studies chart patterns, resistances and supports, has identified these signals:
Near horizontal resistance
Type : Bearish
Timeframe : Daily
Near resistance of channel
Type : Bearish
Timeframe : Daily
Resistance of triangle is broken
Type : Bullish
Timeframe : Daily
The Central Candlesticks scanner, specialised in Japanese candlesticks, did not identify any signals.
ProTrendLines
S3
S2
S1
R1
R2
R3
Price
| S3 | S2 | S1 | Price | R1 | R2 | R3 | |
|---|---|---|---|---|---|---|---|
| ProTrendLines | 83.26 | 84.47 | 85.73 | 86.46 | 86.96 | 88.86 | 90.04 |
| Change (%) | -3.70% | -2.30% | -0.84% | - | +0.58% | +2.78% | +4.14% |
| Change | -3.20 | -1.99 | -0.73 | - | +0.50 | +2.40 | +3.58 |
| Level | Minor | Major | Major | - | Intermediate | Major | Minor |
To determine price objectives, it is also possible to use the pivot points. Here is the price position in relation to pivot points:
Daily
| Pivot points | S3 | S2 | S1 | PP | R1 | R2 | R3 |
|---|---|---|---|---|---|---|---|
| Standard | 85.50 | 85.97 | 86.40 | 86.87 | 87.30 | 87.77 | 88.20 |
| Camarilla | 86.57 | 86.66 | 86.74 | 86.82 | 86.90 | 86.99 | 87.07 |
| Woodie | 85.47 | 85.96 | 86.37 | 86.86 | 87.27 | 87.76 | 88.17 |
| Fibonacci | 85.97 | 86.32 | 86.53 | 86.87 | 87.22 | 87.43 | 87.77 |
Weekly
| Pivot points | S3 | S2 | S1 | PP | R1 | R2 | R3 |
|---|---|---|---|---|---|---|---|
| Standard | 85.92 | 86.36 | 87.00 | 87.44 | 88.08 | 88.52 | 89.16 |
| Camarilla | 87.33 | 87.43 | 87.53 | 87.63 | 87.73 | 87.83 | 87.93 |
| Woodie | 86.01 | 86.41 | 87.09 | 87.49 | 88.17 | 88.57 | 89.25 |
| Fibonacci | 86.36 | 86.78 | 87.03 | 87.44 | 87.86 | 88.11 | 88.52 |
Monthly
| Pivot points | S3 | S2 | S1 | PP | R1 | R2 | R3 |
|---|---|---|---|---|---|---|---|
| Standard | 81.31 | 82.99 | 85.11 | 86.79 | 88.91 | 90.59 | 92.71 |
| Camarilla | 86.19 | 86.53 | 86.88 | 87.23 | 87.58 | 87.93 | 88.28 |
| Woodie | 81.53 | 83.10 | 85.33 | 86.90 | 89.13 | 90.70 | 92.93 |
| Fibonacci | 82.99 | 84.44 | 85.34 | 86.79 | 88.24 | 89.14 | 90.59 |
Numerical data
The following is the status of technical indicators and moving averages registered at the time this technical analysis was created:
Technical indicators
Moving averages
| RSI (14): | 40.36 | |
| MACD (12,26,9): | -0.1500 | |
| Directional Movement: | -14.27 | |
| AROON (14): | 71.43 | |
| DEMA (21): | 86.92 | |
| Parabolic SAR (0,02-0,02-0,2): | 86.14 | |
| Elder Ray (13): | -0.47 | |
| Super Trend (3,10): | 85.70 | |
| Zig ZAG (10): | 86.50 | |
| VORTEX (21): | 0.8800 | |
| Stochastique (14,3,5): | 62.88 | |
| TEMA (21): | 87.07 | |
| Williams %R (14): | -57.44 | |
| Chande Momentum Oscillator (20): | -0.61 | |
| Repulse (5,40,3): | -0.9300 | |
| ROCnROLL: | 2 | |
| TRIX (15,9): | -0.0300 | |
| Courbe Coppock: | 1.05 |
| MA7: | 87.23 | |
| MA20: | 86.95 | |
| MA50: | 87.52 | |
| MA100: | 88.67 | |
| MAexp7: | 87.05 | |
| MAexp20: | 87.15 | |
| MAexp50: | 87.58 | |
| MAexp100: | 87.56 | |
| Price / MA7: | -0.88% | |
| Price / MA20: | -0.56% | |
| Price / MA50: | -1.21% | |
| Price / MA100: | -2.49% | |
| Price / MAexp7: | -0.68% | |
| Price / MAexp20: | -0.79% | |
| Price / MAexp50: | -1.28% | |
| Price / MAexp100: | -1.26% |
Quotes :
-
Real time data
-
Forex
News
The latest news and videos published on CAD/JPY at the time of the analysis were as follows:
-
 Quick Takes Video: BoC Hike Pushes CAD/JPY To Key Resistance, Now What?
-
Forex: Top FX Headlines: GBP/USD Awaits Catalyst; USD/CAD, CAD/JPY at Crossroads: 7/11/17
-
Technical Focus: CAD/JPY - Getting Ready for the Next Big Level
-
Forex: Top FX Headlines: USD/CAD, CAD/JPY in the Spotlight Today - Watch Crude Oil Price: 2/24/17
-
Harmony Stalking an Opportunity on CAD/JPY
This member declared not having a position on this financial instrument or a related financial instrument.
About author

Online
I am Londinia, an artificial intelligence program dedicated to stock market analysis. I am able to analyse and interpret graphical and market data. Learn more…


Add a comment
Comments
0 comments on the analysis CAD/JPY - Daily