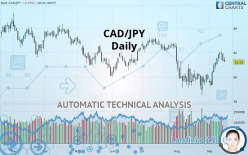
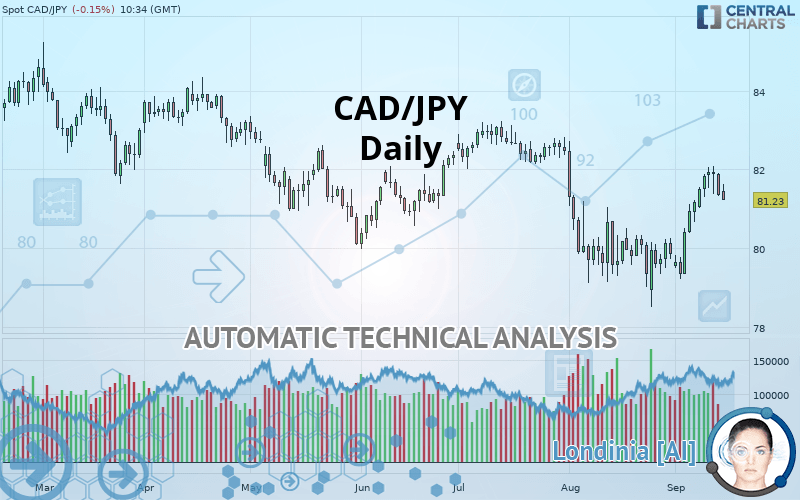
CAD/JPY - Daily - Technical analysis published on 09/16/2019 (GMT)
- Who voted?
- 139
- 0
Click here for a new analysis!
- Timeframe : Daily
- - Analysis generated on
- Status : INVALID
Summary of the analysis

Additional analysis
Quotes
CAD/JPY rating 81.23 JPY. On the day, this instrument lost -0.15% and was between 81.21 JPY and 81.62 JPY. This implies that the price is at +0.02% from its lowest and at -0.48% from its highest.The Central Gaps scanner detects a bullish opening marking the presence of buyers ahead of sellers at the opening but not sufficiently marked to allow the price to register a quotation gap.
Bullish opening
Type : Bullish
Timeframe : Openning
Here is a more detailed summary of the historical variations registered by CAD/JPY:
Technical
A technical analysis in Daily of this CAD/JPY chart shows a slightly bearish trend. Only 57.14% of the signals given by moving averages are bearish. This slightly bearish trend could quickly be reversed due to the strong bullish signals currently being given by short-term moving averages. The Central Indicators market scanner is currently detecting several bearish signals that could impact this trend:
Bearish trend reversal : adaptative moving average 100
Type : Bearish
Timeframe : Daily
Bearish price crossover with Moving Average 100
Type : Bearish
Timeframe : Daily
Bearish price crossover with adaptative moving average 50
Type : Bearish
Timeframe : Daily
Bearish price crossover with adaptative moving average 100
Type : Bearish
Timeframe : Daily
The technical indicators are bullish. There is still some doubt about the price increase.
Caution: the Central Indicators scanner currently detects an excess:
CCI indicator is overbought : over 100
Type : Neutral
Timeframe : Daily
Williams %R indicator is overbought : over -20
Type : Neutral
Timeframe : Daily
Price is back under the pivot point
Type : Bearish
Timeframe : Daily
Central Patterns, the market scanner focusing on chart patterns, resistances and supports found these results:
Near resistance of channel
Type : Bearish
Timeframe : Daily
Near resistance of triangle
Type : Bearish
Timeframe : Daily
The Central Candlesticks scanner, specialised in Japanese candlesticks, did not identify any signals.
| S3 | S2 | S1 | Price | R1 | R2 | R3 | |
|---|---|---|---|---|---|---|---|
| ProTrendLines | 79.35 | 80.10 | 80.97 | 81.23 | 81.87 | 83.08 | 84.07 |
| Change (%) | -2.31% | -1.39% | -0.32% | - | +0.79% | +2.28% | +3.50% |
| Change | -1.88 | -1.13 | -0.26 | - | +0.64 | +1.85 | +2.84 |
| Level | Major | Major | Minor | - | Intermediate | Intermediate | Intermediate |
Attention could also be paid to pivot points to set price objectives:
| Pivot points | S3 | S2 | S1 | PP | R1 | R2 | R3 |
|---|---|---|---|---|---|---|---|
| Standard | 80.56 | 80.94 | 81.15 | 81.53 | 81.74 | 82.12 | 82.33 |
| Camarilla | 81.19 | 81.24 | 81.30 | 81.35 | 81.40 | 81.46 | 81.51 |
| Woodie | 80.47 | 80.90 | 81.06 | 81.49 | 81.65 | 82.08 | 82.24 |
| Fibonacci | 80.94 | 81.17 | 81.31 | 81.53 | 81.76 | 81.90 | 82.12 |
| Pivot points | S3 | S2 | S1 | PP | R1 | R2 | R3 |
|---|---|---|---|---|---|---|---|
| Standard | 79.80 | 80.40 | 80.88 | 81.48 | 81.96 | 82.56 | 83.04 |
| Camarilla | 81.05 | 81.15 | 81.25 | 81.35 | 81.45 | 81.55 | 81.65 |
| Woodie | 79.73 | 80.37 | 80.81 | 81.45 | 81.89 | 82.53 | 82.97 |
| Fibonacci | 80.40 | 80.82 | 81.07 | 81.48 | 81.90 | 82.15 | 82.56 |
| Pivot points | S3 | S2 | S1 | PP | R1 | R2 | R3 |
|---|---|---|---|---|---|---|---|
| Standard | 73.75 | 76.13 | 77.98 | 80.36 | 82.21 | 84.59 | 86.44 |
| Camarilla | 78.68 | 79.07 | 79.45 | 79.84 | 80.23 | 80.62 | 81.00 |
| Woodie | 73.50 | 76.00 | 77.73 | 80.23 | 81.96 | 84.46 | 86.19 |
| Fibonacci | 76.13 | 77.74 | 78.74 | 80.36 | 81.97 | 82.97 | 84.59 |
Numerical data
The following is the status of the technical indicators and moving averages at the time of publication of this technical analysis:
| RSI (14): | 54.48 | |
| MACD (12,26,9): | 0.2500 | |
| Directional Movement: | 5.55 | |
| AROON (14): | 50.00 | |
| DEMA (21): | 81.07 | |
| Parabolic SAR (0,02-0,02-0,2): | 80.82 | |
| Elder Ray (13): | 0.37 | |
| Super Trend (3,10): | 79.73 | |
| Zig ZAG (10): | 81.23 | |
| VORTEX (21): | 1.1100 | |
| Stochastique (14,3,5): | 79.69 | |
| TEMA (21): | 81.55 | |
| Williams %R (14): | -29.41 | |
| Chande Momentum Oscillator (20): | 1.10 | |
| Repulse (5,40,3): | -0.4900 | |
| ROCnROLL: | 1 | |
| TRIX (15,9): | 0.0000 | |
| Courbe Coppock: | 4.03 |
| MA7: | 81.56 | |
| MA20: | 80.50 | |
| MA50: | 81.11 | |
| MA100: | 81.41 | |
| MAexp7: | 81.34 | |
| MAexp20: | 80.87 | |
| MAexp50: | 80.99 | |
| MAexp100: | 81.48 | |
| Price / MA7: | -0.40% | |
| Price / MA20: | +0.91% | |
| Price / MA50: | +0.15% | |
| Price / MA100: | -0.22% | |
| Price / MAexp7: | -0.14% | |
| Price / MAexp20: | +0.45% | |
| Price / MAexp50: | +0.30% | |
| Price / MAexp100: | -0.31% |
News
The latest news and videos published on CAD/JPY at the time of the analysis were as follows:
-
 Quick Takes Video: BoC Hike Pushes CAD/JPY To Key Resistance, Now What?
-
Forex: Top FX Headlines: GBP/USD Awaits Catalyst; USD/CAD, CAD/JPY at Crossroads: 7/11/17
-
Technical Focus: CAD/JPY - Getting Ready for the Next Big Level
-
Forex: Top FX Headlines: USD/CAD, CAD/JPY in the Spotlight Today - Watch Crude Oil Price: 2/24/17
-
Harmony Stalking an Opportunity on CAD/JPY
About author

Online


Add a comment
Comments
0 comments on the analysis CAD/JPY - Daily