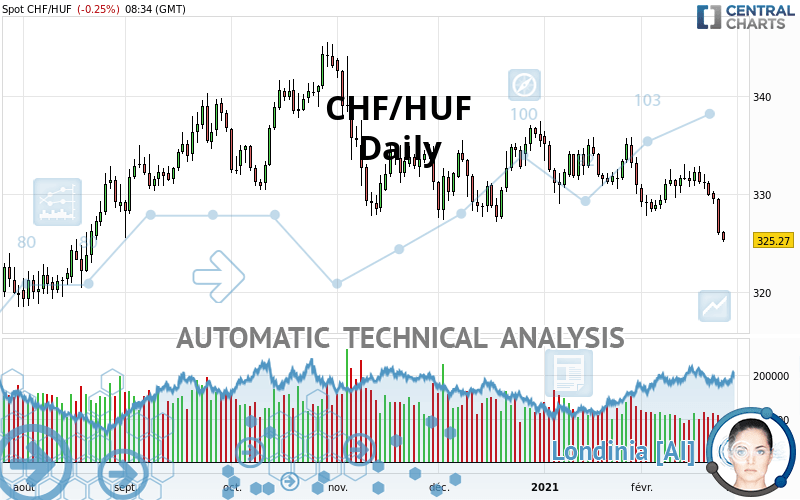
CHF/HUF - Daily - Technical analysis published on 02/24/2021 (GMT)
- 160
- 0
Click here for a new analysis!
- Timeframe : Daily
- - Analysis generated on
- Status : INVALID

Summary of the analysis

Additional analysis
Quotes
The CHF/HUF rating is 325.24 HUF. The price registered a decrease of -0.26% on the session and was between 325.15 HUF and 326.22 HUF. This implies that the price is at +0.03% from its lowest and at -0.30% from its highest.The Central Gaps scanner detects a bullish opening. A small advantage for buyers in the very short term.
Bullish opening
Type : Bullish
Timeframe : Openning
Here is a more detailed summary of the historical variations registered by CHF/HUF:
Near a new HIGH record (1st january)
Type : Bullish
Timeframe : Weekly
Near a new HIGH record (1 month)
Type : Bullish
Timeframe : Weekly
Technical
Technical analysis of CHF/HUF in Daily shows a overall strongly bearish trend. 92.86% of the signals given by moving averages are bearish. This strongly bearish trend is supported by the strong bearish signals given by short-term moving averages. The Central Indicators market scanner currently does not detect any result that concerns moving averages.
In fact, 13 technical indicators on 18 studied are currently positioned bearish. But beware of excesses. The Central Indicators scanner currently detects this:
CCI indicator is oversold : under -100
Type : Neutral
Timeframe : Daily
Williams %R indicator is oversold : under -80
Type : Neutral
Timeframe : Daily
Pivot points : price is under support 3
Type : Neutral
Timeframe : Weekly
Parabolic SAR indicator bearish reversal
Type : Bearish
Timeframe : Daily
Price is back under the pivot point
Type : Bearish
Timeframe : Daily
Momentum indicator is back under 0
Type : Bearish
Timeframe : Daily
The Central Patterns scanner, which studies chart patterns, resistances and supports, has identified these signals:
Horizontal support is broken
Type : Bearish
Timeframe : Daily
Support of channel is broken
Type : Bearish
Timeframe : Daily
Support of triangle is broken
Type : Bearish
Timeframe : Daily
The presence of a bearish pattern in Japanese candlesticks detected by Central Candlesticks that could cause a correction in the very short term was also detected:
Three black crows
Type : Bearish
Timeframe : Daily
| S3 | S2 | S1 | Price | R1 | R2 | R3 | |
|---|---|---|---|---|---|---|---|
| ProTrendLines | 319.32 | 321.70 | 324.45 | 325.24 | 327.63 | 334.16 | 336.73 |
| Change (%) | -1.82% | -1.09% | -0.24% | - | +0.73% | +2.74% | +3.53% |
| Change | -5.92 | -3.54 | -0.79 | - | +2.39 | +8.92 | +11.49 |
| Level | Major | Minor | Minor | - | Major | Intermediate | Intermediate |
Attention could also be paid to pivot points to set price objectives:
| Pivot points | S3 | S2 | S1 | PP | R1 | R2 | R3 |
|---|---|---|---|---|---|---|---|
| Standard | 320.96 | 323.40 | 324.74 | 327.18 | 328.52 | 330.96 | 332.30 |
| Camarilla | 325.03 | 325.38 | 325.72 | 326.07 | 326.42 | 326.76 | 327.11 |
| Woodie | 320.40 | 323.13 | 324.18 | 326.91 | 327.96 | 330.69 | 331.74 |
| Fibonacci | 323.40 | 324.85 | 325.74 | 327.18 | 328.63 | 329.52 | 330.96 |
| Pivot points | S3 | S2 | S1 | PP | R1 | R2 | R3 |
|---|---|---|---|---|---|---|---|
| Standard | 325.70 | 327.74 | 328.84 | 330.88 | 331.98 | 334.02 | 335.12 |
| Camarilla | 329.07 | 329.35 | 329.64 | 329.93 | 330.22 | 330.51 | 330.79 |
| Woodie | 325.22 | 327.51 | 328.36 | 330.65 | 331.50 | 333.79 | 334.64 |
| Fibonacci | 327.74 | 328.94 | 329.68 | 330.88 | 332.08 | 332.82 | 334.02 |
| Pivot points | S3 | S2 | S1 | PP | R1 | R2 | R3 |
|---|---|---|---|---|---|---|---|
| Standard | 320.35 | 324.68 | 327.80 | 332.13 | 335.25 | 339.58 | 342.70 |
| Camarilla | 328.86 | 329.54 | 330.23 | 330.91 | 331.59 | 332.28 | 332.96 |
| Woodie | 319.74 | 324.38 | 327.19 | 331.83 | 334.64 | 339.28 | 342.09 |
| Fibonacci | 324.68 | 327.53 | 329.29 | 332.13 | 334.98 | 336.74 | 339.58 |
Numerical data
The following is the status of the technical indicators and moving averages at the time of publication of this technical analysis:
| RSI (14): | 31.51 | |
| MACD (12,26,9): | -1.0900 | |
| Directional Movement: | -17.34 | |
| AROON (14): | -57.14 | |
| DEMA (21): | 328.88 | |
| Parabolic SAR (0,02-0,02-0,2): | 332.90 | |
| Elder Ray (13): | -3.78 | |
| Super Trend (3,10): | 331.47 | |
| Zig ZAG (10): | 325.86 | |
| VORTEX (21): | 0.8500 | |
| Stochastique (14,3,5): | 12.62 | |
| TEMA (21): | 328.28 | |
| Williams %R (14): | -93.39 | |
| Chande Momentum Oscillator (20): | -5.22 | |
| Repulse (5,40,3): | -1.2300 | |
| ROCnROLL: | 2 | |
| TRIX (15,9): | -0.0300 | |
| Courbe Coppock: | 0.73 |
| MA7: | 329.44 | |
| MA20: | 330.15 | |
| MA50: | 331.80 | |
| MA100: | 333.38 | |
| MAexp7: | 328.58 | |
| MAexp20: | 330.12 | |
| MAexp50: | 331.36 | |
| MAexp100: | 331.79 | |
| Price / MA7: | -1.27% | |
| Price / MA20: | -1.49% | |
| Price / MA50: | -1.98% | |
| Price / MA100: | -2.44% | |
| Price / MAexp7: | -1.01% | |
| Price / MAexp20: | -1.47% | |
| Price / MAexp50: | -1.84% | |
| Price / MAexp100: | -1.97% |
About author

Online


Add a comment
Comments
0 comments on the analysis CHF/HUF - Daily