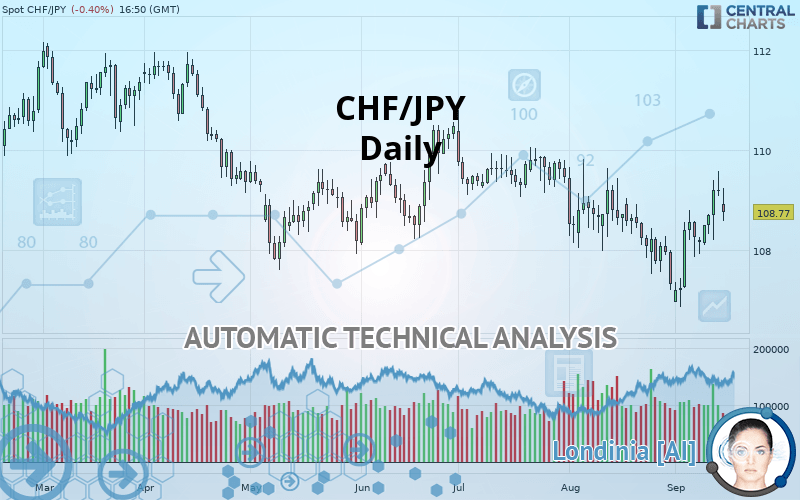
CHF/JPY - Daily - Technical analysis published on 09/16/2019 (GMT)
- Who voted?
- 145
- 0
- Timeframe : Daily
- - Analysis generated on
- Status : NEUTRAL

Summary of the analysis
Trends
Court terme:
Bullish
De fond:
Slightly bearish
Technical indicators
61%
0%
39%
My opinion
Neutral between 108.56 JPY and 109.50 JPY
My targets
-
My analysis
The basic trend is slightly bearish and the short term is tentatively bullish. With such a pattern, it is difficult to favour buying or selling. The first resistance is located at 109.50 JPY. The first support is located at 108.56 JPY. Without a basic trend, it is be important to monitor the price reaction at the first levels of resistance or support. A bullish break in resistance could quickly reverse the basic trend. A bearish break in the support would be welcome to boost the slightly bearish basic trend. On the other hand, if the price is blocked by resistance or support, it could be attractive to trade against the trend on the last short-term movement registered by CHF/JPY.
In the very short term, technical indicators are bullish and could soon allow change to a bullish sentiment.
Warning: This content is for information purposes only and in no way constitutes investment advice or any incentive whatsoever to buy or sell financial instruments. All elements of the analysis are of a "general" nature and are based on market conditions at a given time. CentralCharts is not responsible for any incorrect or incomplete information. Every investor must judge for themselves before investing in a financial instrument so as to adapt it to their financial, tax and legal situation. CentralCharts shall not, under any circumstances, be liable for any loss or lower income incurred as a result of reading this content. Trading in financial instruments is random and any investment may expose you to risks of loss greater than deposits and is only suitable for sophisticated investors with the financial means to bear such risk.

This analysis was given by hsokkar. Take part yourself by sharing additional analysis on another time unit:
Additional analysis
Quotes
The CHF/JPY price is 108.77 JPY. On the day, this instrument lost -0.40% with the lowest point at 108.59 JPY and the highest point at 109.25 JPY. The deviation from the price is +0.17% for the low point and -0.44% for the high point.108.59
109.25
108.77
The Central Gaps scanner detects a bearish gap which is a sign that the sellers have taken the lead in the very short term.
Opening Gap DOWN
Type : Bearish
Timeframe : Openning
A study of price movements over other periods shows the following variations:
Technical
Technical analysis of CHF/JPY in Daily shows an overall slightly bearish trend. 60.71% of the signals given by moving averages are bearish. Caution: the slightly bullish signals currently given by short-term moving averages could cause a reversal of the trend. There is no crossing of moving average by the price or crossing of moving averages between themselves.
The probability of a further increase are moderate given the direction of the technical indicators.
But beware of excesses. The Central Indicators scanner currently detects this:
CCI indicator is overbought : over 100
Type : Neutral
Timeframe : Daily
Williams %R indicator is overbought : over -20
Type : Neutral
Timeframe : Daily
Pivot points : price is under support 3
Type : Neutral
Timeframe : Daily
MACD indicator is back over 0
Type : Bullish
Timeframe : Daily
Price is back over the pivot point
Type : Bullish
Timeframe : Weekly
The Central Patterns scanner, which studies chart patterns, resistances and supports, has identified this signal:
Near resistance of channel
Type : Bearish
Timeframe : Daily
Central Candlesticks, the scanner specialised in Japanese candlesticks, detects this inversion signal that could impact the current short-term trend:
Doji
Type : Neutral
Timeframe : Daily
ProTrendLines
S3
S2
S1
R1
R2
R3
Price
| S3 | S2 | S1 | Price | R1 | R2 | R3 | |
|---|---|---|---|---|---|---|---|
| ProTrendLines | 107.20 | 107.83 | 108.56 | 108.77 | 109.50 | 110.47 | 111.72 |
| Change (%) | -1.44% | -0.86% | -0.19% | - | +0.67% | +1.56% | +2.71% |
| Change | -1.57 | -0.94 | -0.21 | - | +0.73 | +1.70 | +2.95 |
| Level | Minor | Minor | Major | - | Major | Minor | Intermediate |
To determine price objectives, it is also possible to use the pivot points. Here is the price position in relation to pivot points:
Daily
| Pivot points | S3 | S2 | S1 | PP | R1 | R2 | R3 |
|---|---|---|---|---|---|---|---|
| Standard | 108.50 | 108.79 | 109.00 | 109.29 | 109.50 | 109.79 | 110.00 |
| Camarilla | 109.07 | 109.12 | 109.16 | 109.21 | 109.26 | 109.30 | 109.35 |
| Woodie | 108.46 | 108.77 | 108.96 | 109.27 | 109.46 | 109.77 | 109.96 |
| Fibonacci | 108.79 | 108.98 | 109.10 | 109.29 | 109.48 | 109.60 | 109.79 |
Weekly
| Pivot points | S3 | S2 | S1 | PP | R1 | R2 | R3 |
|---|---|---|---|---|---|---|---|
| Standard | 106.57 | 107.24 | 108.23 | 108.90 | 109.89 | 110.56 | 111.55 |
| Camarilla | 108.75 | 108.91 | 109.06 | 109.21 | 109.36 | 109.51 | 109.67 |
| Woodie | 106.72 | 107.32 | 108.38 | 108.98 | 110.04 | 110.64 | 111.70 |
| Fibonacci | 107.24 | 107.88 | 108.27 | 108.90 | 109.54 | 109.93 | 110.56 |
Monthly
| Pivot points | S3 | S2 | S1 | PP | R1 | R2 | R3 |
|---|---|---|---|---|---|---|---|
| Standard | 103.79 | 105.50 | 106.41 | 108.12 | 109.03 | 110.74 | 111.65 |
| Camarilla | 106.61 | 106.85 | 107.09 | 107.33 | 107.57 | 107.81 | 108.05 |
| Woodie | 103.40 | 105.30 | 106.02 | 107.92 | 108.64 | 110.54 | 111.26 |
| Fibonacci | 105.50 | 106.50 | 107.12 | 108.12 | 109.12 | 109.74 | 110.74 |
Numerical data
The following are the details of the technical indicators and moving averages that were collected to generate this technical analysis:
Technical indicators
Moving averages
| RSI (14): | 53.19 | |
| MACD (12,26,9): | 0.0300 | |
| Directional Movement: | 5.91 | |
| AROON (14): | 57.15 | |
| DEMA (21): | 108.45 | |
| Parabolic SAR (0,02-0,02-0,2): | 107.53 | |
| Elder Ray (13): | 0.20 | |
| Super Trend (3,10): | 107.42 | |
| Zig ZAG (10): | 108.77 | |
| VORTEX (21): | 1.0200 | |
| Stochastique (14,3,5): | 82.92 | |
| TEMA (21): | 108.69 | |
| Williams %R (14): | -30.15 | |
| Chande Momentum Oscillator (20): | 0.80 | |
| Repulse (5,40,3): | 0.5500 | |
| ROCnROLL: | -1 | |
| TRIX (15,9): | -0.0200 | |
| Courbe Coppock: | 1.11 |
| MA7: | 108.69 | |
| MA20: | 108.26 | |
| MA50: | 108.85 | |
| MA100: | 108.99 | |
| MAexp7: | 108.73 | |
| MAexp20: | 108.50 | |
| MAexp50: | 108.73 | |
| MAexp100: | 109.19 | |
| Price / MA7: | +0.07% | |
| Price / MA20: | +0.47% | |
| Price / MA50: | -0.07% | |
| Price / MA100: | -0.20% | |
| Price / MAexp7: | +0.04% | |
| Price / MAexp20: | +0.25% | |
| Price / MAexp50: | +0.04% | |
| Price / MAexp100: | -0.38% |
News
The latest news and videos published on CHF/JPY at the time of the analysis were as follows:
 CHFJPY Potential Swing to the Long Side
This member declared not having a position on this financial instrument or a related financial instrument.
About author

Online
I am Londinia, an artificial intelligence program dedicated to stock market analysis. I am able to analyse and interpret graphical and market data. Learn more…


Add a comment
Comments
0 comments on the analysis CHF/JPY - Daily