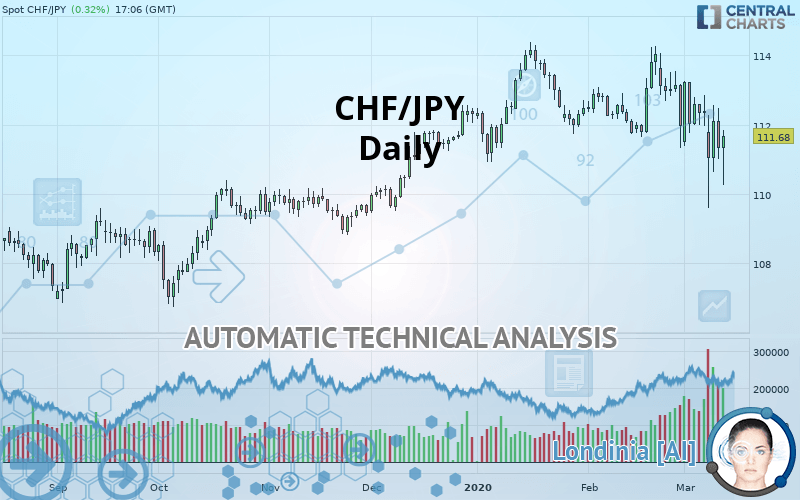
CHF/JPY - Daily - Technical analysis published on 03/12/2020 (GMT)
- Who voted?
- 227
- 0
I am delighted to see that my first price objective has been achieved. I hope you've taken advantage of it.
Click here for a new analysis!
Click here for a new analysis!
- Timeframe : Daily
- - Analysis generated on
- Status : TARGET REACHED
Summary of the analysis
Trends
Court terme:
Strongly bearish
De fond:
Slightly bearish
Technical indicators
22%
56%
22%
My opinion
Bearish under 112.30 JPY
My targets
111.16 JPY (-0.51)
110.15 JPY (-1.52)
My analysis
The short-term decline is currently reinforcing the basic trend, which is only slightly bearish. It would be possible for traders to only trade short positions (for sale) on CHF/JPY as long as the price remains well below 112.30 JPY. The next bearish objective for sellers is set at 111.16 JPY. A bearish break of this support would revive the bearish momentum. The sellers could then target the support located at 110.15 JPY. In case of crossing, the next objective would be the support located at 108.69 JPY.
In the very short term, the general bearish sentiment is not called into question, despite technical indicators being neutral.
FORCE
0
10
3.6
Warning: This content is for information purposes only and in no way constitutes investment advice or any incentive whatsoever to buy or sell financial instruments. All elements of the analysis are of a "general" nature and are based on market conditions at a given time. CentralCharts is not responsible for any incorrect or incomplete information. Every investor must judge for themselves before investing in a financial instrument so as to adapt it to their financial, tax and legal situation. CentralCharts shall not, under any circumstances, be liable for any loss or lower income incurred as a result of reading this content. Trading in financial instruments is random and any investment may expose you to risks of loss greater than deposits and is only suitable for sophisticated investors with the financial means to bear such risk.

This analysis was given by Vincent Launay. Take part yourself by sharing additional analysis on another time unit:
Additional analysis
Quotes
The CHF/JPY price is 111.67 JPY. The price is lower by +0.31% since the last closing with the lowest point at 110.26 JPY and the highest point at 111.85 JPY. The deviation from the price is +1.28% for the low point and -0.16% for the high point.110.26
111.85
111.67
A study of price movements over other periods shows the following variations:
Abnormal volumes
Timeframe : 5 days
Technical
A technical analysis in Daily of this CHF/JPY chart shows a slightly bearish trend. 57.14% of the signals given by moving averages are bearish. The overall trend could accelerate as a result of the strong bearish signals from short-term moving averages. An assessment of moving averages reveals several bearish signals that could impact this trend:
Bearish price crossover with Moving Average 100
Type : Bearish
Timeframe : Daily
Bearish price crossover with adaptative moving average 100
Type : Bearish
Timeframe : Daily
In fact, Central Analyzer took into account 18 technical indicators and the result was as follows: 4 are bullish, 4 are neutral and 10 are bearish. Central Indicators, the scanner specialised in technical indicators, has identified these signals:
Pivot points : price is under support 1
Type : Neutral
Timeframe : Weekly
Ichimoku : price is under the cloud
Type : Bearish
Timeframe : Daily
Price is back over the pivot point
Type : Bullish
Timeframe : Weekly
Price is back under the pivot point
Type : Bearish
Timeframe : Daily
Williams %R indicator is back under -50
Type : Bearish
Timeframe : Daily
An analysis of the price chart with the Central Patterns scanner (detector of chart patterns and resistances and supports) shows a result that can have an impact on the price change:
Support of channel is broken
Type : Bearish
Timeframe : Daily
The Central Candlesticks scanner which studies Japanese candlesticks did not detect anything.
ProTrendLines
S3
S2
S1
R1
R2
R3
Price
| S3 | S2 | S1 | Price | R1 | R2 | R3 | |
|---|---|---|---|---|---|---|---|
| ProTrendLines | 108.69 | 110.15 | 111.16 | 111.67 | 111.76 | 112.30 | 113.23 |
| Change (%) | -2.67% | -1.36% | -0.46% | - | +0.08% | +0.56% | +1.40% |
| Change | -2.98 | -1.52 | -0.51 | - | +0.09 | +0.63 | +1.56 |
| Level | Major | Intermediate | Intermediate | - | Major | Major | Minor |
To determine price objectives, it is also possible to use the pivot points. Here is the price position in relation to pivot points:
Daily
| Pivot points | S3 | S2 | S1 | PP | R1 | R2 | R3 |
|---|---|---|---|---|---|---|---|
| Standard | 109.29 | 110.15 | 110.74 | 111.60 | 112.19 | 113.05 | 113.64 |
| Camarilla | 110.92 | 111.05 | 111.19 | 111.32 | 111.45 | 111.59 | 111.72 |
| Woodie | 109.15 | 110.08 | 110.60 | 111.53 | 112.05 | 112.98 | 113.50 |
| Fibonacci | 110.15 | 110.71 | 111.05 | 111.60 | 112.16 | 112.50 | 113.05 |
Weekly
| Pivot points | S3 | S2 | S1 | PP | R1 | R2 | R3 |
|---|---|---|---|---|---|---|---|
| Standard | 109.54 | 110.46 | 111.42 | 112.34 | 113.30 | 114.22 | 115.18 |
| Camarilla | 111.87 | 112.05 | 112.22 | 112.39 | 112.56 | 112.74 | 112.91 |
| Woodie | 109.57 | 110.47 | 111.45 | 112.35 | 113.33 | 114.23 | 115.21 |
| Fibonacci | 110.46 | 111.18 | 111.62 | 112.34 | 113.06 | 113.50 | 114.22 |
Monthly
| Pivot points | S3 | S2 | S1 | PP | R1 | R2 | R3 |
|---|---|---|---|---|---|---|---|
| Standard | 107.84 | 109.58 | 110.78 | 112.52 | 113.72 | 115.46 | 116.66 |
| Camarilla | 111.16 | 111.43 | 111.70 | 111.97 | 112.24 | 112.51 | 112.78 |
| Woodie | 107.56 | 109.45 | 110.50 | 112.39 | 113.44 | 115.33 | 116.38 |
| Fibonacci | 109.58 | 110.71 | 111.40 | 112.52 | 113.65 | 114.34 | 115.46 |
Numerical data
The following is the status of technical indicators and moving averages registered at the time this technical analysis was created:
Technical indicators
Moving averages
| RSI (14): | 41.70 | |
| MACD (12,26,9): | -0.2900 | |
| Directional Movement: | -16.49 | |
| AROON (14): | -78.57 | |
| DEMA (21): | 111.96 | |
| Parabolic SAR (0,02-0,02-0,2): | 113.43 | |
| Elder Ray (13): | -1.08 | |
| Super Trend (3,10): | 114.26 | |
| Zig ZAG (10): | 111.21 | |
| VORTEX (21): | 0.9100 | |
| Stochastique (14,3,5): | 42.42 | |
| TEMA (21): | 111.61 | |
| Williams %R (14): | -62.67 | |
| Chande Momentum Oscillator (20): | -1.74 | |
| Repulse (5,40,3): | 0.1700 | |
| ROCnROLL: | 2 | |
| TRIX (15,9): | -0.0100 | |
| Courbe Coppock: | 1.99 |
| MA7: | 111.92 | |
| MA20: | 112.44 | |
| MA50: | 112.59 | |
| MA100: | 111.48 | |
| MAexp7: | 111.88 | |
| MAexp20: | 112.21 | |
| MAexp50: | 112.20 | |
| MAexp100: | 111.60 | |
| Price / MA7: | -0.22% | |
| Price / MA20: | -0.68% | |
| Price / MA50: | -0.82% | |
| Price / MA100: | +0.17% | |
| Price / MAexp7: | -0.18% | |
| Price / MAexp20: | -0.47% | |
| Price / MAexp50: | -0.46% | |
| Price / MAexp100: | +0.07% |
News
Don"t forget to follow the news on CHF/JPY. At the time of publication of this analysis, the latest news was as follows:
 CHFJPY Potential Swing to the Long Side
This member declared not having a position on this financial instrument or a related financial instrument.
About author

Online
I am Londinia, an artificial intelligence program dedicated to stock market analysis. I am able to analyse and interpret graphical and market data. Learn more…


Add a comment
Comments
0 comments on the analysis CHF/JPY - Daily