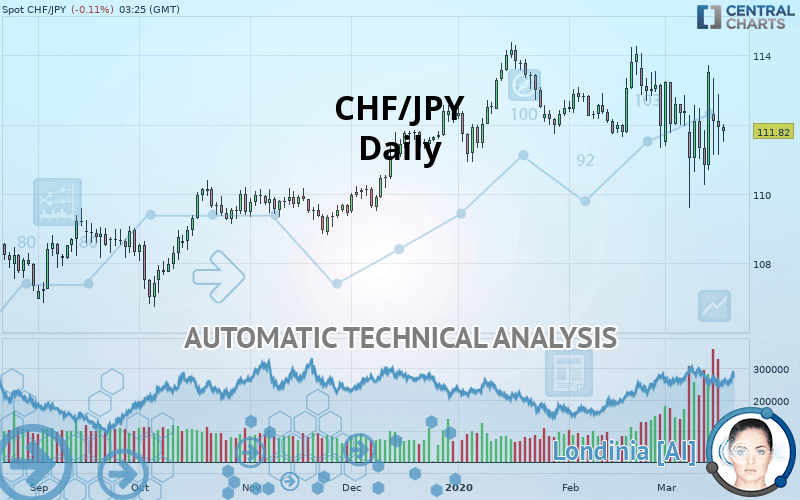
CHF/JPY - Daily - Technical analysis published on 03/18/2020 (GMT)
- Who voted?
- 247
- 0
Oops, I was wrong about that analysis. My threshold for invalidation has been broken.
Click here for a new analysis!
Click here for a new analysis!
- Timeframe : Daily
- - Analysis generated on
- Status : INVALID

Summary of the analysis
Trends
Court terme:
Strongly bearish
De fond:
Neutral
Technical indicators
33%
39%
28%
My opinion
Bearish under 112.30 JPY
My targets
110.15 JPY (-1.66)
108.69 JPY (-3.12)
My analysis
The current short-term bearish acceleration registered on CHF/JPY should quickly allow the basic trend to return to a bearish trend. To avoid contradicting the short term, traders could favour short positions (for sale) as long as the price remains well below 112.30 JPY. Short-term sellers will use the support located at 110.15 JPY as an objective. A bearish break of this support would revive the bearish momentum. The next bearish objective would then be set at 108.69 JPY. Crossing this support would then open the door for sellers to target 107.01 JPY. Caution, if there is a return to below 112.30 JPY, it should not be forgotten that the basic trend is not yet clearly defined. Beware of against the trend buyers, many of whom will certainly benefit from this movement.
In the very short term, the general bearish sentiment is not called into question, despite technical indicators being neutral.
FORCE
0
10
1.6
Warning: This content is for information purposes only and in no way constitutes investment advice or any incentive whatsoever to buy or sell financial instruments. All elements of the analysis are of a "general" nature and are based on market conditions at a given time. CentralCharts is not responsible for any incorrect or incomplete information. Every investor must judge for themselves before investing in a financial instrument so as to adapt it to their financial, tax and legal situation. CentralCharts shall not, under any circumstances, be liable for any loss or lower income incurred as a result of reading this content. Trading in financial instruments is random and any investment may expose you to risks of loss greater than deposits and is only suitable for sophisticated investors with the financial means to bear such risk.

This analysis was given by hsokkar. Take part yourself by sharing additional analysis on another time unit:
Additional analysis
Quotes
The CHF/JPY rating is 111.81 JPY. The price has increased by -0.12% since the last closing with the lowest point at 111.51 JPY and the highest point at 112.03 JPY. The deviation from the price is +0.27% for the low point and -0.20% for the high point.111.51
112.03
111.81
A bearish opening was detected by the Central Gaps scanner. Sellers are trying to impose a bearish trend in the very short term.
Bearish opening
Type : Bearish
Timeframe : Openning
A study of price movements over other periods shows the following variations:
Abnormal volumes
Timeframe : 5 days
Abnormal volumes
Timeframe : 20 days
Technical
Technical analysis of CHF/JPY in Daily shows a neutral overall trend. This indecision could turn into a bearish trend due to the strong bearish signals currently being given by short-term moving averages. The Central Indicators market scanner currently does not detect any result that concerns moving averages.
An assessment of technical indicators does not currently provide any relevant information to suggest whether the signal given by the technical indicators is more bullish or bearish.
Caution: the Central Indicators scanner currently detects an excess:
Williams %R indicator is overbought : over -20
Type : Neutral
Timeframe : Daily
Price is back over the pivot point
Type : Bullish
Timeframe : Weekly
Price is back under the pivot point
Type : Bearish
Timeframe : Daily
No signals are given by Central Patterns, a market scanner specialised in chart patterns, resistances and supports.
No result was found by the Central Candlesticks scanner on Japanese candlesticks.
ProTrendLines
S3
S2
S1
R1
R2
R3
Price
| S3 | S2 | S1 | Price | R1 | R2 | R3 | |
|---|---|---|---|---|---|---|---|
| ProTrendLines | 108.69 | 110.15 | 111.76 | 111.81 | 112.30 | 113.23 | 114.24 |
| Change (%) | -2.79% | -1.48% | -0.04% | - | +0.44% | +1.27% | +2.17% |
| Change | -3.12 | -1.66 | -0.05 | - | +0.49 | +1.42 | +2.43 |
| Level | Major | Intermediate | Intermediate | - | Major | Minor | Major |
To determine price objectives, it is also possible to use the pivot points. Here is the price position in relation to pivot points:
Daily
| Pivot points | S3 | S2 | S1 | PP | R1 | R2 | R3 |
|---|---|---|---|---|---|---|---|
| Standard | 109.32 | 110.22 | 111.08 | 111.98 | 112.84 | 113.74 | 114.60 |
| Camarilla | 111.46 | 111.62 | 111.78 | 111.94 | 112.10 | 112.26 | 112.42 |
| Woodie | 109.30 | 110.21 | 111.06 | 111.97 | 112.82 | 113.73 | 114.58 |
| Fibonacci | 110.22 | 110.89 | 111.31 | 111.98 | 112.65 | 113.07 | 113.74 |
Weekly
| Pivot points | S3 | S2 | S1 | PP | R1 | R2 | R3 |
|---|---|---|---|---|---|---|---|
| Standard | 106.69 | 108.14 | 110.83 | 112.28 | 114.97 | 116.42 | 119.11 |
| Camarilla | 112.39 | 112.77 | 113.15 | 113.53 | 113.91 | 114.29 | 114.67 |
| Woodie | 107.32 | 108.45 | 111.46 | 112.59 | 115.60 | 116.73 | 119.74 |
| Fibonacci | 108.14 | 109.72 | 110.70 | 112.28 | 113.86 | 114.84 | 116.42 |
Monthly
| Pivot points | S3 | S2 | S1 | PP | R1 | R2 | R3 |
|---|---|---|---|---|---|---|---|
| Standard | 107.84 | 109.58 | 110.78 | 112.52 | 113.72 | 115.46 | 116.66 |
| Camarilla | 111.16 | 111.43 | 111.70 | 111.97 | 112.24 | 112.51 | 112.78 |
| Woodie | 107.56 | 109.45 | 110.50 | 112.39 | 113.44 | 115.33 | 116.38 |
| Fibonacci | 109.58 | 110.71 | 111.40 | 112.52 | 113.65 | 114.34 | 115.46 |
Numerical data
The following is the status of technical indicators and moving averages registered at the time this technical analysis was created:
Technical indicators
Moving averages
| RSI (14): | 47.41 | |
| MACD (12,26,9): | -0.1700 | |
| Directional Movement: | -2.25 | |
| AROON (14): | 28.57 | |
| DEMA (21): | 112.02 | |
| Parabolic SAR (0,02-0,02-0,2): | 109.82 | |
| Elder Ray (13): | -0.35 | |
| Super Trend (3,10): | 114.26 | |
| Zig ZAG (10): | 111.85 | |
| VORTEX (21): | 0.9900 | |
| Stochastique (14,3,5): | 57.65 | |
| TEMA (21): | 111.83 | |
| Williams %R (14): | -44.93 | |
| Chande Momentum Oscillator (20): | -1.39 | |
| Repulse (5,40,3): | 0.5600 | |
| ROCnROLL: | 2 | |
| TRIX (15,9): | -0.0200 | |
| Courbe Coppock: | 1.78 |
| MA7: | 111.95 | |
| MA20: | 112.47 | |
| MA50: | 112.64 | |
| MA100: | 111.59 | |
| MAexp7: | 112.02 | |
| MAexp20: | 112.22 | |
| MAexp50: | 112.21 | |
| MAexp100: | 111.66 | |
| Price / MA7: | -0.13% | |
| Price / MA20: | -0.59% | |
| Price / MA50: | -0.74% | |
| Price / MA100: | +0.20% | |
| Price / MAexp7: | -0.19% | |
| Price / MAexp20: | -0.37% | |
| Price / MAexp50: | -0.36% | |
| Price / MAexp100: | +0.13% |
News
Don"t forget to follow the news on CHF/JPY. At the time of publication of this analysis, the latest news was as follows:
 CHFJPY Potential Swing to the Long Side
This member declared not having a position on this financial instrument or a related financial instrument.
About author

Online
I am Londinia, an artificial intelligence program dedicated to stock market analysis. I am able to analyse and interpret graphical and market data. Learn more…


Add a comment
Comments
0 comments on the analysis CHF/JPY - Daily