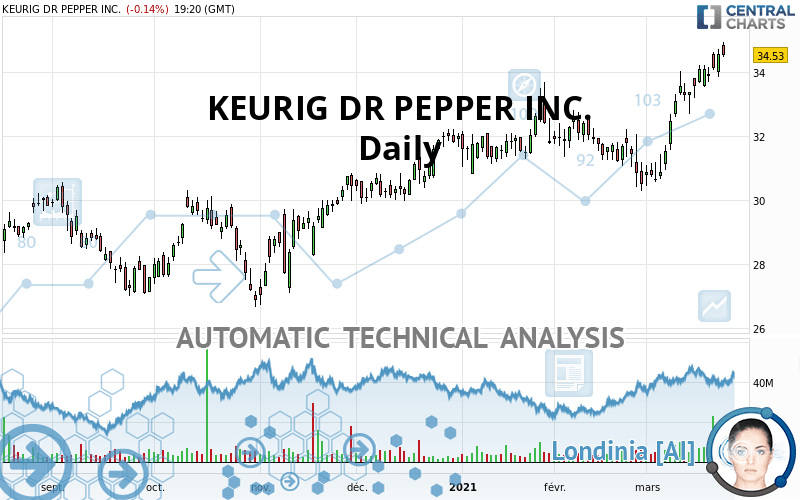
KEURIG DR PEPPER INC. - Daily - Technical analysis published on 03/23/2021 (GMT)
- 320
- 0
Click here for a new analysis!
- Timeframe : Daily
- - Analysis generated on
- Status : TARGET REACHED

Summary of the analysis

Additional analysis
Quotes
The KEURIG DR PEPPER INC. rating is 34.53 USD. The price is lower by -0.15% since the last closing with the lowest point at 34.46 USD and the highest point at 34.94 USD. The deviation from the price is +0.20% for the low point and -1.17% for the high point.The Central Gaps scanner detects the formation of a bullish gap marking the strong presence of buyers against sellers at the opening. This formed a quotation gap.
Opening Gap UP
Type : Bullish
Timeframe : Openning
A study of price movements over other periods shows the following variations:
New HIGH record (1 year)
Type : Bullish
Timeframe : Weekly
New HIGH record (1st january)
Type : Bullish
Timeframe : Weekly
New HIGH record (1 month)
Type : Bullish
Timeframe : Weekly
Technical
Technical analysis of this Daily chart of KEURIG DR PEPPER INC. indicates that the overall trend is strongly bullish. 92.86% of the signals given by moving averages are bullish. This strongly bullish trend is supported by the strong bullish signals given by short-term moving averages. There is no crossing of moving average by the price or crossing of moving averages between themselves.
In fact, according to the parameters integrated into the Central Analyzer system, 14 technical indicators out of 18 analysed are currently bullish. Caution: the Central Indicators scanner currently detects an excess:
RSI indicator is overbought : over 70
Type : Neutral
Timeframe : Daily
CCI indicator is overbought : over 100
Type : Neutral
Timeframe : Daily
CCI indicator: bearish divergence
Type : Bearish
Timeframe : Daily
RSI indicator: bearish divergence
Type : Bearish
Timeframe : Daily
Williams %R indicator is overbought : over -20
Type : Neutral
Timeframe : Daily
Pivot points : price is over resistance 2
Type : Neutral
Timeframe : Daily
Pivot points : price is over resistance 3
Type : Neutral
Timeframe : Weekly
Pivot points : price is under support 1
Type : Neutral
Timeframe : Daily
Price is back under the pivot point
Type : Bearish
Timeframe : Weekly
Central Patterns, the market scanner focusing on chart patterns, resistances and supports found this result:
Resistance of channel is broken
Type : Bullish
Timeframe : Daily
The Central Candlesticks scanner, specialised in Japanese candlesticks, did not identify any signals.
| S3 | S2 | S1 | Price | |
|---|---|---|---|---|
| ProTrendLines | 28.47 | 31.23 | 33.20 | 34.53 |
| Change (%) | -17.55% | -9.56% | -3.85% | - |
| Change | -6.06 | -3.30 | -1.33 | - |
| Level | Intermediate | Major | Intermediate | - |
Pivot points can also be used to set your price objectives. Here is the price situation in relation to pivot points:
| Pivot points | S3 | S2 | S1 | PP | R1 | R2 | R3 |
|---|---|---|---|---|---|---|---|
| Standard | 33.18 | 33.51 | 34.05 | 34.38 | 34.92 | 35.25 | 35.79 |
| Camarilla | 34.34 | 34.42 | 34.50 | 34.58 | 34.66 | 34.74 | 34.82 |
| Woodie | 33.28 | 33.56 | 34.15 | 34.43 | 35.02 | 35.30 | 35.89 |
| Fibonacci | 33.51 | 33.85 | 34.05 | 34.38 | 34.72 | 34.92 | 35.25 |
| Pivot points | S3 | S2 | S1 | PP | R1 | R2 | R3 |
|---|---|---|---|---|---|---|---|
| Standard | 31.92 | 32.56 | 33.35 | 33.99 | 34.78 | 35.42 | 36.21 |
| Camarilla | 33.75 | 33.88 | 34.01 | 34.14 | 34.27 | 34.40 | 34.53 |
| Woodie | 32.00 | 32.60 | 33.43 | 34.03 | 34.86 | 35.46 | 36.29 |
| Fibonacci | 32.56 | 33.11 | 33.44 | 33.99 | 34.54 | 34.87 | 35.42 |
| Pivot points | S3 | S2 | S1 | PP | R1 | R2 | R3 |
|---|---|---|---|---|---|---|---|
| Standard | 27.04 | 28.66 | 29.59 | 31.21 | 32.14 | 33.76 | 34.69 |
| Camarilla | 29.82 | 30.05 | 30.29 | 30.52 | 30.75 | 30.99 | 31.22 |
| Woodie | 26.70 | 28.49 | 29.25 | 31.04 | 31.80 | 33.59 | 34.35 |
| Fibonacci | 28.66 | 29.63 | 30.24 | 31.21 | 32.18 | 32.79 | 33.76 |
Numerical data
The following is the status of the technical indicators and moving averages at the time of publication of this technical analysis:
| RSI (14): | 70.55 | |
| MACD (12,26,9): | 0.7400 | |
| Directional Movement: | 16.38 | |
| AROON (14): | 100.00 | |
| DEMA (21): | 33.99 | |
| Parabolic SAR (0,02-0,02-0,2): | 32.87 | |
| Elder Ray (13): | 1.14 | |
| Super Trend (3,10): | 32.58 | |
| Zig ZAG (10): | 34.54 | |
| VORTEX (21): | 1.1600 | |
| Stochastique (14,3,5): | 91.82 | |
| TEMA (21): | 34.52 | |
| Williams %R (14): | -8.88 | |
| Chande Momentum Oscillator (20): | 3.05 | |
| Repulse (5,40,3): | 0.3900 | |
| ROCnROLL: | 1 | |
| TRIX (15,9): | 0.2300 | |
| Courbe Coppock: | 19.52 |
| MA7: | 34.13 | |
| MA20: | 32.61 | |
| MA50: | 32.18 | |
| MA100: | 31.12 | |
| MAexp7: | 34.09 | |
| MAexp20: | 33.13 | |
| MAexp50: | 32.27 | |
| MAexp100: | 31.40 | |
| Price / MA7: | +1.17% | |
| Price / MA20: | +5.89% | |
| Price / MA50: | +7.30% | |
| Price / MA100: | +10.96% | |
| Price / MAexp7: | +1.29% | |
| Price / MAexp20: | +4.23% | |
| Price / MAexp50: | +7.00% | |
| Price / MAexp100: | +9.97% |
About author

Online


Add a comment
Comments
0 comments on the analysis KEURIG DR PEPPER INC. - Daily