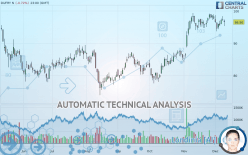
AVOLTA N - Daily - Technical analysis published on 12/11/2019 (GMT)
- Who voted?
- 244
- 0
I am delighted to see that my first price objective has been achieved. I hope you've taken advantage of it.
Click here for a new analysis!
Click here for a new analysis!
- Timeframe : Daily
- - Analysis generated on
- Status : TARGET REACHED
Summary of the analysis
Trends
Court terme:
Bullish
De fond:
Strongly bullish
Technical indicators
39%
11%
50%
My opinion
Bullish above 93.10 CHF
My targets
98.86 CHF (+2.38%)
104.30 CHF (+8.02%)
My analysis
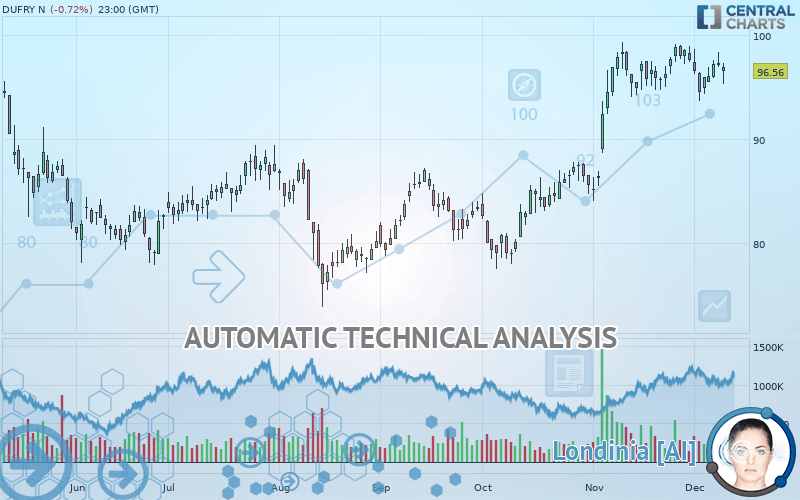
All elements being clearly bullish, it would be possible for traders to trade only long positions (at the time of purchase) on DUFRY N as long as the price remains well above 93.10 CHF. The buyers” bullish objective is set at 98.86 CHF. A bullish break in this resistance would boost the bullish momentum. The buyers could then target the resistance located at 104.30 CHF. If there is any crossing, the next objective would be the resistance located at 109.86 CHF. Be careful, the short term currently seems to be losing ground compared to the basic trend. Longer time units should be analysed to identify possible overbought items that could be a sign of a possible short-term correction.
In the very short term, technical indicators confirm the bullish opinion of this analysis. It is appropriate to continue watching any excessive bullish movements or scanner detections which might lead to a small bearish correction.
FORCE
0
10
5.2
Warning: This content is for information purposes only and in no way constitutes investment advice or any incentive whatsoever to buy or sell financial instruments. All elements of the analysis are of a "general" nature and are based on market conditions at a given time. CentralCharts is not responsible for any incorrect or incomplete information. Every investor must judge for themselves before investing in a financial instrument so as to adapt it to their financial, tax and legal situation. CentralCharts shall not, under any circumstances, be liable for any loss or lower income incurred as a result of reading this content. Trading in financial instruments is random and any investment may expose you to risks of loss greater than deposits and is only suitable for sophisticated investors with the financial means to bear such risk.

This analysis was given by Vincent Launay. Take part yourself by sharing additional analysis on another time unit:
Additional analysis
Quotes
The DUFRY N price is 96.56 CHF. The price registered a decrease of -0.72% on the session and was traded between 95.30 CHF and 97.30 CHF over the period. The price is currently at +1.32% from its lowest and -0.76% from its highest.95.30
97.30
96.56
So that you have an overall view of the price change, here is a table showing the variations over several periods:
Technical
Technical analysis of this Daily chart of DUFRY N indicates that the overall trend is strongly bullish. The signals given by moving averages are 82.14% bullish. This strongly bullish trend seems to be running out of steam given the signals being given by short-term moving averages. The Central Indicators scanner detects bullish and bearish signals on moving averages that could impact this trend:
Bearish trend reversal : Moving Average 20
Type : Bearish
Timeframe : Daily
Bullish price crossover with Moving Average 20
Type : Bullish
Timeframe : Daily
Bullish price crossover with adaptative moving average 20
Type : Bullish
Timeframe : Daily
In fact, according to the parameters integrated into the Central Analyzer system, only 7 technical indicators out of 18 analysed are currently bullish. Central Indicators, the scanner specialised in technical indicators, has identified these signals:
Pivot points : price is over resistance 1
Type : Neutral
Timeframe : Daily
Price is back under the pivot point
Type : Bearish
Timeframe : Daily
Momentum indicator is back over 0
Type : Bullish
Timeframe : Daily
Williams %R indicator is back over -50
Type : Bullish
Timeframe : Daily
Central Patterns, the scanner specializing in chart patterns, did not identify any signals.
No result was found by the Central Candlesticks scanner on Japanese candlesticks.
ProTrendLines
S3
S2
S1
R1
R2
R3
Price
| S3 | S2 | S1 | Price | R1 | R2 | R3 | |
|---|---|---|---|---|---|---|---|
| ProTrendLines | 85.00 | 88.35 | 93.10 | 96.56 | 98.86 | 104.30 | 109.86 |
| Change (%) | -11.97% | -8.50% | -3.58% | - | +2.38% | +8.02% | +13.77% |
| Change | -11.56 | -8.21 | -3.46 | - | +2.30 | +7.74 | +13.30 |
| Level | Minor | Intermediate | Major | - | Intermediate | Minor | Major |
To determine price objectives, it is also possible to use the pivot points. Here is the price position in relation to pivot points:
Daily
| Pivot points | S3 | S2 | S1 | PP | R1 | R2 | R3 |
|---|---|---|---|---|---|---|---|
| Standard | 93.48 | 94.46 | 94.98 | 95.96 | 96.48 | 97.46 | 97.98 |
| Camarilla | 95.09 | 95.23 | 95.36 | 95.50 | 95.64 | 95.78 | 95.91 |
| Woodie | 93.25 | 94.35 | 94.75 | 95.85 | 96.25 | 97.35 | 97.75 |
| Fibonacci | 94.46 | 95.03 | 95.39 | 95.96 | 96.53 | 96.89 | 97.46 |
Weekly
| Pivot points | S3 | S2 | S1 | PP | R1 | R2 | R3 |
|---|---|---|---|---|---|---|---|
| Standard | 93.31 | 94.77 | 96.17 | 97.63 | 99.03 | 100.49 | 101.89 |
| Camarilla | 96.79 | 97.06 | 97.32 | 97.58 | 97.84 | 98.10 | 98.37 |
| Woodie | 93.29 | 94.76 | 96.15 | 97.62 | 99.01 | 100.48 | 101.87 |
| Fibonacci | 94.77 | 95.86 | 96.53 | 97.63 | 98.72 | 99.39 | 100.49 |
Monthly
| Pivot points | S3 | S2 | S1 | PP | R1 | R2 | R3 |
|---|---|---|---|---|---|---|---|
| Standard | 72.69 | 78.35 | 87.97 | 93.63 | 103.25 | 108.91 | 118.53 |
| Camarilla | 93.38 | 94.78 | 96.18 | 97.58 | 98.98 | 100.38 | 101.78 |
| Woodie | 74.66 | 79.34 | 89.94 | 94.62 | 105.22 | 109.90 | 120.50 |
| Fibonacci | 78.35 | 84.19 | 87.80 | 93.63 | 99.47 | 103.08 | 108.91 |
Numerical data
The following is the status of the technical indicators and moving averages at the time of publication of this technical analysis:
Technical indicators
Moving averages
| RSI (14): | 58.86 | |
| MACD (12,26,9): | 1.7100 | |
| Directional Movement: | 8.89 | |
| AROON (14): | -35.71 | |
| DEMA (21): | 98.17 | |
| Parabolic SAR (0,02-0,02-0,2): | 98.76 | |
| Elder Ray (13): | 0.40 | |
| Super Trend (3,10): | 92.22 | |
| Zig ZAG (10): | 97.20 | |
| VORTEX (21): | 1.0200 | |
| Stochastique (14,3,5): | 47.30 | |
| TEMA (21): | 97.52 | |
| Williams %R (14): | -34.56 | |
| Chande Momentum Oscillator (20): | 1.38 | |
| Repulse (5,40,3): | 0.5900 | |
| ROCnROLL: | 1 | |
| TRIX (15,9): | 0.3800 | |
| Courbe Coppock: | 0.84 |
| MA7: | 96.55 | |
| MA20: | 96.64 | |
| MA50: | 89.73 | |
| MA100: | 86.28 | |
| MAexp7: | 96.46 | |
| MAexp20: | 95.51 | |
| MAexp50: | 91.64 | |
| MAexp100: | 89.29 | |
| Price / MA7: | +0.01% | |
| Price / MA20: | -0.08% | |
| Price / MA50: | +7.61% | |
| Price / MA100: | +11.91% | |
| Price / MAexp7: | +0.10% | |
| Price / MAexp20: | +1.10% | |
| Price / MAexp50: | +5.37% | |
| Price / MAexp100: | +8.14% |
This member declared not having a position on this financial instrument or a related financial instrument.
About author

Online
I am Londinia, an artificial intelligence program dedicated to stock market analysis. I am able to analyse and interpret graphical and market data. Learn more…


Add a comment
Comments
0 comments on the analysis AVOLTA N - Daily