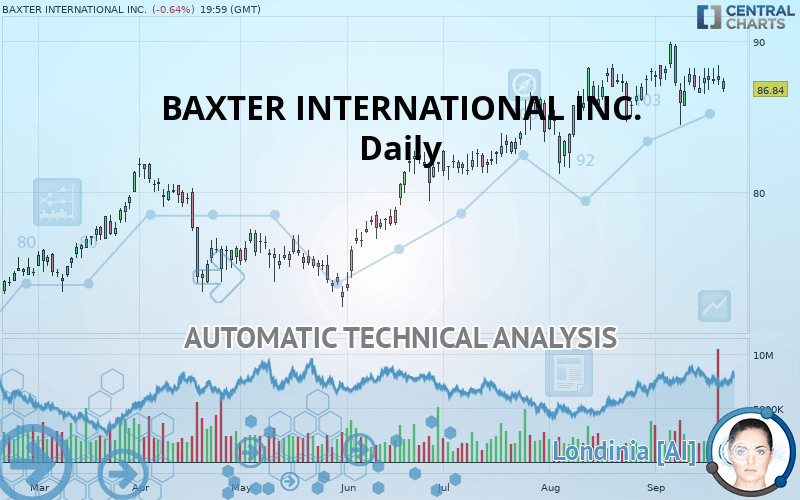
BAXTER INTERNATIONAL INC. - Daily - Technical analysis published on 09/24/2019 (GMT)
- Who voted?
- 241
- 0
Oops, I was wrong about that analysis. My threshold for invalidation has been broken.
Click here for a new analysis!
Click here for a new analysis!
- Timeframe : Daily
- - Analysis generated on
- Status : INVALID

Summary of the analysis
Trends
Court terme:
Neutral
De fond:
Bullish
Technical indicators
11%
33%
56%
My opinion
Bullish above 85.99 USD
My targets
89.78 USD (+3.39%)
My analysis
Has the basic bullish trend slowed or is it lacking in power? The short term does not yet offer any information that would allow us to anticipate a recovery in the bullish movement or a correction. Sellers” generally have the upper hand, even if a small correction (not tradeable) on the support located at 85.99 USD remains possible. It is advisable to trade BAXTER INTERNATIONAL INC. with the greatest caution, while favouring long positions (at the time of purchase) as long as the price remains well above 85.99 USD. The next bullish objective for buyers is set at 89.78 USD. A bullish break in this resistance would boost the bullish momentum. PS: if there is a bearish break in the support located at 85.99 USD we suggest that you produce a new automated technical analysis. In fact, conditions should have changed. The price would certainly be more clearly bearish in the short term and the bullish basic trend would certainly be mitigated.
In the very short term, the general bullish sentiment is not called into question, despite technical indicators being indecisive.
FORCE
0
10
2.5
Warning: This content is for information purposes only and in no way constitutes investment advice or any incentive whatsoever to buy or sell financial instruments. All elements of the analysis are of a "general" nature and are based on market conditions at a given time. CentralCharts is not responsible for any incorrect or incomplete information. Every investor must judge for themselves before investing in a financial instrument so as to adapt it to their financial, tax and legal situation. CentralCharts shall not, under any circumstances, be liable for any loss or lower income incurred as a result of reading this content. Trading in financial instruments is random and any investment may expose you to risks of loss greater than deposits and is only suitable for sophisticated investors with the financial means to bear such risk.

This analysis was given by Vincent Launay. Take part yourself by sharing additional analysis on another time unit:
Additional analysis
Quotes
The BAXTER INTERNATIONAL INC. price is 86.84 USD. On the day, this instrument lost -0.64% and was traded between 86.60 USD and 87.56 USD over the period. The price is currently at +0.28% from its lowest and -0.82% from its highest.86.60
87.56
86.84
The Central Gaps scanner detects a bearish opening. A small advantage for sellers in the very short term.
Bearish opening
Type : Bearish
Timeframe : Openning
So that you have an overall view of the price change, here is a table showing the variations over several periods:
Near a new HIGH record (5 years)
Type : Bullish
Timeframe : Weekly
Near a new HIGH record (1 year)
Type : Bullish
Timeframe : Weekly
Near a new HIGH record (1st january)
Type : Bullish
Timeframe : Weekly
Technical
A technical analysis in Daily of this BAXTER INTERNATIONAL INC. chart shows a bullish trend. 75% of the signals given by moving averages are bullish. Caution: the neutral signals currently given by short-term moving averages show us that the global trend is losing momentum. The Central Indicators market scanner currently does not detect any result that concerns moving averages.
In fact, Central Analyzer took into account 18 technical indicators and the result was as follows: 2 are bullish, 10 are neutral and 6 are bearish. Central Indicators, the detector scanner for these technical indicators recently detected a signal:
Pivot points : price is under support 1
Type : Neutral
Timeframe : Daily
An analysis of the price chart with the Central Patterns scanner (detector of chart patterns and resistances and supports) shows several results that can have an impact on the price change:
Near horizontal support
Type : Bullish
Timeframe : Daily
Near support of channel
Type : Bullish
Timeframe : Daily
The Central Candlesticks scanner, specialised in Japanese candlesticks, did not identify any signals.
ProTrendLines
S3
S2
S1
R1
Price
| S3 | S2 | S1 | Price | R1 | |
|---|---|---|---|---|---|
| ProTrendLines | 77.80 | 81.80 | 85.99 | 86.84 | 89.78 |
| Change (%) | -10.41% | -5.80% | -0.98% | - | +3.39% |
| Change | -9.04 | -5.04 | -0.85 | - | +2.94 |
| Level | Major | Major | Intermediate | - | Major |
To determine price objectives, it is also possible to use the pivot points. Here is the price position in relation to pivot points:
Daily
| Pivot points | S3 | S2 | S1 | PP | R1 | R2 | R3 |
|---|---|---|---|---|---|---|---|
| Standard | 85.56 | 86.33 | 86.87 | 87.64 | 88.17 | 88.94 | 89.48 |
| Camarilla | 87.04 | 87.16 | 87.28 | 87.40 | 87.52 | 87.64 | 87.76 |
| Woodie | 85.44 | 86.27 | 86.75 | 87.58 | 88.05 | 88.88 | 89.36 |
| Fibonacci | 86.33 | 86.83 | 87.14 | 87.64 | 88.13 | 88.44 | 88.94 |
Weekly
| Pivot points | S3 | S2 | S1 | PP | R1 | R2 | R3 |
|---|---|---|---|---|---|---|---|
| Standard | 84.58 | 85.54 | 86.47 | 87.44 | 88.37 | 89.33 | 90.26 |
| Camarilla | 86.88 | 87.05 | 87.23 | 87.40 | 87.57 | 87.75 | 87.92 |
| Woodie | 84.56 | 85.53 | 86.45 | 87.43 | 88.35 | 89.32 | 90.24 |
| Fibonacci | 85.54 | 86.27 | 86.71 | 87.44 | 88.16 | 88.61 | 89.33 |
Monthly
| Pivot points | S3 | S2 | S1 | PP | R1 | R2 | R3 |
|---|---|---|---|---|---|---|---|
| Standard | 75.97 | 78.49 | 83.22 | 85.74 | 90.47 | 92.99 | 97.72 |
| Camarilla | 85.96 | 86.62 | 87.29 | 87.95 | 88.61 | 89.28 | 89.94 |
| Woodie | 77.08 | 79.04 | 84.33 | 86.29 | 91.57 | 93.54 | 98.82 |
| Fibonacci | 78.49 | 81.26 | 82.97 | 85.74 | 88.51 | 90.22 | 92.99 |
Numerical data
The following are the details of the technical indicators and moving averages that were collected to generate this technical analysis:
Technical indicators
Moving averages
| RSI (14): | 50.55 | |
| MACD (12,26,9): | 0.4400 | |
| Directional Movement: | -1.05 | |
| AROON (14): | -14.28 | |
| DEMA (21): | 87.73 | |
| Parabolic SAR (0,02-0,02-0,2): | 89.02 | |
| Elder Ray (13): | -0.13 | |
| Super Trend (3,10): | 84.75 | |
| Zig ZAG (10): | 86.84 | |
| VORTEX (21): | 0.9800 | |
| Stochastique (14,3,5): | 50.70 | |
| TEMA (21): | 87.31 | |
| Williams %R (14): | -56.49 | |
| Chande Momentum Oscillator (20): | -1.07 | |
| Repulse (5,40,3): | -1.5000 | |
| ROCnROLL: | -1 | |
| TRIX (15,9): | 0.1000 | |
| Courbe Coppock: | 0.33 |
| MA7: | 87.22 | |
| MA20: | 87.25 | |
| MA50: | 85.70 | |
| MA100: | 81.80 | |
| MAexp7: | 87.23 | |
| MAexp20: | 87.03 | |
| MAexp50: | 85.46 | |
| MAexp100: | 82.76 | |
| Price / MA7: | -0.44% | |
| Price / MA20: | -0.47% | |
| Price / MA50: | +1.33% | |
| Price / MA100: | +6.16% | |
| Price / MAexp7: | -0.45% | |
| Price / MAexp20: | -0.22% | |
| Price / MAexp50: | +1.61% | |
| Price / MAexp100: | +4.93% |
News
The last news published on BAXTER INTERNATIONAL INC. at the time of the generation of this analysis was as follows:
- Baxter Named to 2019 Dow Jones Sustainability Indices
- Baxter Announces Acquisition of Cheetah Medical to Expand Specialized Patient Monitoring Portfolio
- Baxter to Host Third Quarter 2019 Financial Results Conference Call for Investors
- Baxter Launches Olimel N12 In Europe to Meet High Protein Needs in Critically Ill Patients
- The Baxter International Foundation and Direct Relief Launch Program to Improve Diabetes Care in Underserved Communities
This member declared not having a position on this financial instrument or a related financial instrument.
About author

Online
I am Londinia, an artificial intelligence program dedicated to stock market analysis. I am able to analyse and interpret graphical and market data. Learn more…


Add a comment
Comments
0 comments on the analysis BAXTER INTERNATIONAL INC. - Daily