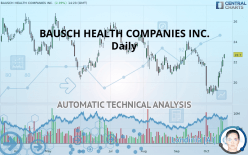
BAUSCH HEALTH COMPANIES INC. - Daily - Technical analysis published on 10/17/2019 (GMT)
- Who voted?
- 168
- 0
Click here for a new analysis!
- Timeframe : Daily
- - Analysis generated on
- Status : TARGET REACHED

Summary of the analysis

Additional analysis
Quotes
BAUSCH HEALTH COMPANIES INC. rating 22.70 USD. On the day, this instrument gained +2.39% and was traded between 22.31 USD and 22.77 USD over the period. The price is currently at +1.75% from its lowest and -0.31% from its highest.A bullish opening was detected by the Central Gaps scanner. Buyers are trying to impose a bullish momentum in the very short term.
Bullish opening
Type : Bullish
Timeframe : Openning
So that you have an overall view of the price change, here is a table showing the variations over several periods:
Near a new HIGH record (1 month)
Type : Bullish
Timeframe : Weekly
Technical
Technical analysis of this Daily chart of BAUSCH HEALTH COMPANIES INC. indicates that the overall trend is bullish. 67.86% of the signals given by moving averages are bullish. This bullish trend shows slight signs of slowing down given the slightly bullish signals given by the short-term moving averages. The Central Indicators scanner detects bullish signals on moving averages that could impact this trend:
Bullish trend reversal : adaptative moving average 50
Type : Bullish
Timeframe : Daily
Bullish price crossover with Moving Average 50
Type : Bullish
Timeframe : Daily
Bullish price crossover with adaptative moving average 50
Type : Bullish
Timeframe : Daily
The probability of a further increase is high given the direction of the technical indicators.
Caution: the Central Indicators scanner currently detects an excess:
Williams %R indicator is overbought : over -20
Type : Neutral
Timeframe : Daily
Pivot points : price is over resistance 2
Type : Neutral
Timeframe : Weekly
Aroon indicator bullish trend
Type : Bullish
Timeframe : Daily
SuperTrend indicator bullish reversal
Type : Bullish
Timeframe : Daily
Price is back over the pivot point
Type : Bullish
Timeframe : Daily
Momentum indicator is back over 0
Type : Bullish
Timeframe : Daily
Central Patterns, the market scanner focusing on chart patterns, resistances and supports found this result:
Horizontal resistance is broken
Type : Bullish
Timeframe : Daily
No result was found by the Central Candlesticks scanner on Japanese candlesticks.
| S3 | S2 | S1 | Price | R1 | R2 | R3 | |
|---|---|---|---|---|---|---|---|
| ProTrendLines | 18.89 | 20.81 | 21.85 | 22.70 | 22.91 | 23.79 | 24.63 |
| Change (%) | -16.78% | -8.33% | -3.74% | - | +0.93% | +4.80% | +8.50% |
| Change | -3.81 | -1.89 | -0.85 | - | +0.21 | +1.09 | +1.93 |
| Level | Major | Major | Major | - | Intermediate | Major | Minor |
To determine price objectives, it is also possible to use the pivot points. Here is the price position in relation to pivot points:
| Pivot points | S3 | S2 | S1 | PP | R1 | R2 | R3 |
|---|---|---|---|---|---|---|---|
| Standard | 20.64 | 21.07 | 21.62 | 22.05 | 22.60 | 23.03 | 23.58 |
| Camarilla | 21.90 | 21.99 | 22.08 | 22.17 | 22.26 | 22.35 | 22.44 |
| Woodie | 20.70 | 21.10 | 21.68 | 22.08 | 22.66 | 23.06 | 23.64 |
| Fibonacci | 21.07 | 21.44 | 21.68 | 22.05 | 22.42 | 22.66 | 23.03 |
| Pivot points | S3 | S2 | S1 | PP | R1 | R2 | R3 |
|---|---|---|---|---|---|---|---|
| Standard | 16.93 | 17.83 | 19.22 | 20.12 | 21.51 | 22.41 | 23.80 |
| Camarilla | 19.99 | 20.20 | 20.41 | 20.62 | 20.83 | 21.04 | 21.25 |
| Woodie | 17.19 | 17.95 | 19.48 | 20.24 | 21.77 | 22.53 | 24.06 |
| Fibonacci | 17.83 | 18.70 | 19.24 | 20.12 | 20.99 | 21.53 | 22.41 |
| Pivot points | S3 | S2 | S1 | PP | R1 | R2 | R3 |
|---|---|---|---|---|---|---|---|
| Standard | 17.51 | 19.28 | 20.56 | 22.33 | 23.61 | 25.38 | 26.66 |
| Camarilla | 21.01 | 21.29 | 21.57 | 21.85 | 22.13 | 22.41 | 22.69 |
| Woodie | 17.28 | 19.16 | 20.33 | 22.21 | 23.38 | 25.26 | 26.43 |
| Fibonacci | 19.28 | 20.44 | 21.16 | 22.33 | 23.49 | 24.21 | 25.38 |
Numerical data
The following is the status of technical indicators and moving averages registered at the time this technical analysis was created:
| RSI (14): | 62.22 | |
| MACD (12,26,9): | -0.1600 | |
| Directional Movement: | 12.07 | |
| AROON (14): | 57.14 | |
| DEMA (21): | 20.69 | |
| Parabolic SAR (0,02-0,02-0,2): | 19.32 | |
| Elder Ray (13): | 1.56 | |
| Super Trend (3,10): | 19.97 | |
| Zig ZAG (10): | 22.70 | |
| VORTEX (21): | 0.9100 | |
| Stochastique (14,3,5): | 88.22 | |
| TEMA (21): | 20.90 | |
| Williams %R (14): | -1.77 | |
| Chande Momentum Oscillator (20): | 2.91 | |
| Repulse (5,40,3): | 4.5800 | |
| ROCnROLL: | 1 | |
| TRIX (15,9): | -0.3500 | |
| Courbe Coppock: | 4.82 |
| MA7: | 20.86 | |
| MA20: | 20.84 | |
| MA50: | 21.60 | |
| MA100: | 22.43 | |
| MAexp7: | 21.26 | |
| MAexp20: | 21.04 | |
| MAexp50: | 21.64 | |
| MAexp100: | 22.29 | |
| Price / MA7: | +8.82% | |
| Price / MA20: | +8.93% | |
| Price / MA50: | +5.09% | |
| Price / MA100: | +1.20% | |
| Price / MAexp7: | +6.77% | |
| Price / MAexp20: | +7.89% | |
| Price / MAexp50: | +4.90% | |
| Price / MAexp100: | +1.84% |
About author

Online


Add a comment
Comments
0 comments on the analysis BAUSCH HEALTH COMPANIES INC. - Daily