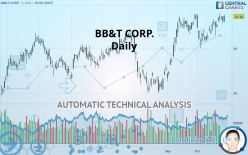
BB&T CORP. - Daily - Technical analysis published on 10/28/2019 (GMT)
- Who voted?
- 136
- 0
Click here for a new analysis!
- Timeframe : Daily
- - Analysis generated on
- Status : INVALID

Summary of the analysis
Additional analysis
Quotes
BB&T CORP. rating 53.58 USD. The price registered an increase of +1.00% on the session and was traded between 52.98 USD and 53.81 USD over the period. The price is currently at +1.13% from its lowest and -0.43% from its highest.The Central Gaps scanner detects a bearish opening. A small advantage for sellers in the very short term.
Bearish opening
Type : Bearish
Timeframe : Openning
Here is a more detailed summary of the historical variations registered by BB&T CORP.:
New HIGH record (5 years)
Type : Bullish
Timeframe : Weekly
Near a new HIGH record (1 year)
Type : Bullish
Timeframe : Weekly
Near a new HIGH record (1st january)
Type : Bullish
Timeframe : Weekly
Near a new HIGH record (1 month)
Type : Bullish
Timeframe : Weekly
Technical
Technical analysis of BB&T CORP. in Daily shows a strongly overall bullish trend. The signals given by the moving averages are 92.86% bullish. This strong bullish trend is confirmed by the strong signals currently being given by short-term moving averages. The Central Indicators scanner does not detect any result on moving averages that would impact this trend.
Technical indicators are strongly bullish, suggesting that the price increase should continue.
But beware of excesses. The Central Indicators scanner currently detects this:
RSI indicator: bearish divergence
Type : Bearish
Timeframe : Daily
Williams %R indicator is overbought : over -20
Type : Neutral
Timeframe : Daily
Pivot points : price is over resistance 1
Type : Neutral
Timeframe : Daily
Pivot points : price is over resistance 1
Type : Neutral
Timeframe : Weekly
Price is back under the pivot point
Type : Bearish
Timeframe : Daily
Central Patterns, the market scanner focusing on chart patterns, resistances and supports found these results:
Near resistance of channel
Type : Bearish
Timeframe : Daily
Horizontal resistance is broken
Type : Bullish
Timeframe : Daily
For a small setback in the very short term, the Central Candlesticks scanner currently notes the presence of this bearish pattern in Japanese candlesticks:
Bearish engulfing lines
Type : Bearish
Timeframe : Daily
| S3 | S2 | S1 | Price | R1 | |
|---|---|---|---|---|---|
| ProTrendLines | 48.52 | 51.83 | 53.46 | 53.58 | 56.03 |
| Change (%) | -9.44% | -3.27% | -0.22% | - | +4.57% |
| Change | -5.06 | -1.75 | -0.12 | - | +2.45 |
| Level | Minor | Major | Intermediate | - | Major |
Attention could also be paid to pivot points to set price objectives:
| Pivot points | S3 | S2 | S1 | PP | R1 | R2 | R3 |
|---|---|---|---|---|---|---|---|
| Standard | 51.83 | 52.31 | 52.68 | 53.16 | 53.53 | 54.01 | 54.38 |
| Camarilla | 52.82 | 52.89 | 52.97 | 53.05 | 53.13 | 53.21 | 53.28 |
| Woodie | 51.78 | 52.28 | 52.63 | 53.13 | 53.48 | 53.98 | 54.33 |
| Fibonacci | 52.31 | 52.64 | 52.84 | 53.16 | 53.49 | 53.69 | 54.01 |
| Pivot points | S3 | S2 | S1 | PP | R1 | R2 | R3 |
|---|---|---|---|---|---|---|---|
| Standard | 49.73 | 50.56 | 51.62 | 52.45 | 53.51 | 54.34 | 55.40 |
| Camarilla | 52.15 | 52.32 | 52.50 | 52.67 | 52.84 | 53.02 | 53.19 |
| Woodie | 49.84 | 50.62 | 51.73 | 52.51 | 53.62 | 54.40 | 55.51 |
| Fibonacci | 50.56 | 51.29 | 51.73 | 52.45 | 53.18 | 53.62 | 54.34 |
| Pivot points | S3 | S2 | S1 | PP | R1 | R2 | R3 |
|---|---|---|---|---|---|---|---|
| Standard | 41.00 | 43.66 | 48.52 | 51.18 | 56.04 | 58.70 | 63.56 |
| Camarilla | 51.30 | 51.99 | 52.68 | 53.37 | 54.06 | 54.75 | 55.44 |
| Woodie | 42.09 | 44.21 | 49.61 | 51.73 | 57.13 | 59.25 | 64.65 |
| Fibonacci | 43.66 | 46.54 | 48.31 | 51.18 | 54.06 | 55.83 | 58.70 |
Numerical data
The following is the status of the technical indicators and moving averages at the time of publication of this technical analysis:
| RSI (14): | 62.25 | |
| MACD (12,26,9): | 0.6300 | |
| Directional Movement: | 4.86 | |
| AROON (14): | 71.43 | |
| DEMA (21): | 53.37 | |
| Parabolic SAR (0,02-0,02-0,2): | 51.37 | |
| Elder Ray (13): | 0.57 | |
| Super Trend (3,10): | 50.76 | |
| Zig ZAG (10): | 53.58 | |
| VORTEX (21): | 0.9700 | |
| Stochastique (14,3,5): | 81.56 | |
| TEMA (21): | 53.35 | |
| Williams %R (14): | -12.08 | |
| Chande Momentum Oscillator (20): | 2.59 | |
| Repulse (5,40,3): | 0.8500 | |
| ROCnROLL: | 1 | |
| TRIX (15,9): | 0.1600 | |
| Courbe Coppock: | 5.99 |
| MA7: | 53.16 | |
| MA20: | 52.30 | |
| MA50: | 50.72 | |
| MA100: | 49.76 | |
| MAexp7: | 53.16 | |
| MAexp20: | 52.51 | |
| MAexp50: | 51.32 | |
| MAexp100: | 50.22 | |
| Price / MA7: | +0.79% | |
| Price / MA20: | +2.45% | |
| Price / MA50: | +5.64% | |
| Price / MA100: | +7.68% | |
| Price / MAexp7: | +0.79% | |
| Price / MAexp20: | +2.04% | |
| Price / MAexp50: | +4.40% | |
| Price / MAexp100: | +6.69% |
News
The latest news and videos published on BB&T CORP. at the time of the analysis were as follows:
- BB&T Announces Redemption of Certain Depositary Shares
- BB&T Decreases Prime Lending Rate
- BB&T Announces Third-Quarter Dividends
- BB&T shareholders approve merger of equals with SunTrust
- SunTrust Shareholders Approve Merger with BB&T to Form Truist
About author

Online


Add a comment
Comments
0 comments on the analysis BB&T CORP. - Daily