EUR/CAD - Daily - Technical analysis published on 05/15/2020 (GMT)
- Who voted?
- 215
- 0
- Timeframe : Daily
- - Analysis generated on
- Status : NEUTRAL
Summary of the analysis
Trends
Court terme:
Bearish
De fond:
Slightly bullish
Technical indicators
39%
22%
39%
My opinion
Neutral between 1.5092 CAD and 1.5411 CAD
My targets
-
My analysis
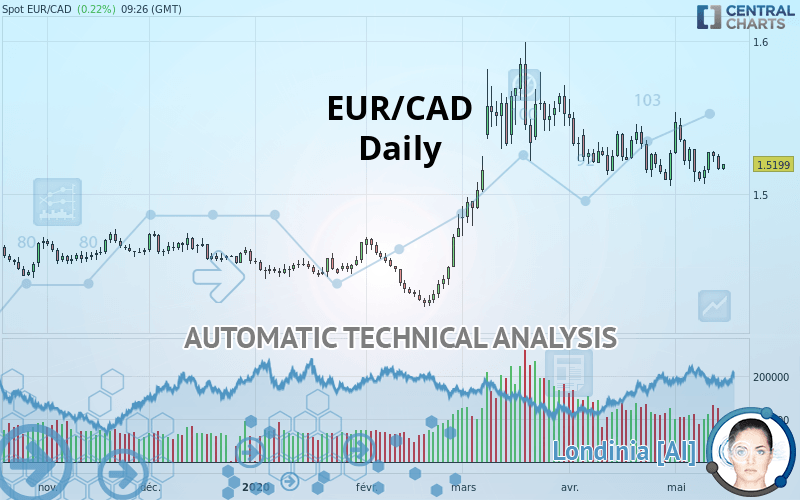
The short-term decline on EUR/CAD remains moderate but it could call into question the slightly bullish basic trend. It is difficult to advise a trading direction under these conditions. The first support is located at 1.5092 CAD. The first resistance is located at 1.5411 CAD. You could remain on the sidelines waiting for a more pronounced price movement on this instrument. A new analysis could then be carried out to provide clearer signals.
In the very short term, technical indicators are neutral and are not able to influence the opinion of this analysis.
Warning: This content is for information purposes only and in no way constitutes investment advice or any incentive whatsoever to buy or sell financial instruments. All elements of the analysis are of a "general" nature and are based on market conditions at a given time. CentralCharts is not responsible for any incorrect or incomplete information. Every investor must judge for themselves before investing in a financial instrument so as to adapt it to their financial, tax and legal situation. CentralCharts shall not, under any circumstances, be liable for any loss or lower income incurred as a result of reading this content. Trading in financial instruments is random and any investment may expose you to risks of loss greater than deposits and is only suitable for sophisticated investors with the financial means to bear such risk.

This analysis was given by Remo. Take part yourself by sharing additional analysis on another time unit:
Additional analysis
Quotes
The EUR/CAD rating is 1.5199 CAD. On the day, this instrument gained +0.22% with the lowest point at 1.5155 CAD and the highest point at 1.5199 CAD. The deviation from the price is +0.29% for the low point and 0% for the high point.1.5155
1.5199
1.5199
A bullish opening was detected by the Central Gaps scanner. Buyers are trying to impose a bullish momentum in the very short term.
Bullish opening
Type : Bullish
Timeframe : Openning
Here is a more detailed summary of the historical variations registered by EUR/CAD:
Technical
Technical analysis of this Daily chart of EUR/CAD indicates that the overall trend is slightly bullish. Only 53.57% of the signals given by moving averages are bullish. This slightly bullish trend could turn neutral or reverse given the slightly bearish signals currently being given by short-term moving averages. The Central Indicators scanner detects bearish signals on moving averages that could impact this trend:
Bearish trend reversal : adaptative moving average 20
Type : Bearish
Timeframe : Daily
Bearish trend reversal : adaptative moving average 50
Type : Bearish
Timeframe : Daily
Bearish price crossover with Moving Average 20
Type : Bearish
Timeframe : Daily
In fact, Central Analyzer took into account 18 technical indicators and the result was as follows: 7 are bullish, 7 are neutral and 4 are bearish. Other results related to technical indicators were also found by the Central Indicators scanner:
Ichimoku - Bearish crossover : Tenkan & Kijun
Type : Bearish
Timeframe : Daily
Price is back under the pivot point
Type : Bearish
Timeframe : Daily
Price is back under the pivot point
Type : Bearish
Timeframe : Weekly
An analysis of the price chart with the Central Patterns scanner (detector of chart patterns and resistances and supports) shows several results that can have an impact on the price change:
Near horizontal support
Type : Bullish
Timeframe : Daily
Support of channel is broken
Type : Bearish
Timeframe : Daily
Support of triangle is broken
Type : Bearish
Timeframe : Daily
The Central Candlesticks scanner which studies Japanese candlesticks did not detect anything.
ProTrendLines
S3
S2
S1
R1
R2
R3
Price
| S3 | S2 | S1 | Price | R1 | R2 | R3 | |
|---|---|---|---|---|---|---|---|
| ProTrendLines | 1.4737 | 1.4894 | 1.5092 | 1.5199 | 1.5213 | 1.5411 | 1.5642 |
| Change (%) | -3.04% | -2.01% | -0.70% | - | +0.09% | +1.39% | +2.91% |
| Change | -0.0462 | -0.0305 | -0.0107 | - | +0.0014 | +0.0212 | +0.0443 |
| Level | Major | Major | Major | - | Major | Major | Intermediate |
Attention could also be paid to pivot points to set price objectives:
Daily
| Pivot points | S3 | S2 | S1 | PP | R1 | R2 | R3 |
|---|---|---|---|---|---|---|---|
| Standard | 1.5018 | 1.5086 | 1.5126 | 1.5194 | 1.5234 | 1.5302 | 1.5342 |
| Camarilla | 1.5135 | 1.5145 | 1.5155 | 1.5165 | 1.5175 | 1.5185 | 1.5195 |
| Woodie | 1.5003 | 1.5079 | 1.5111 | 1.5187 | 1.5219 | 1.5295 | 1.5327 |
| Fibonacci | 1.5086 | 1.5128 | 1.5153 | 1.5194 | 1.5236 | 1.5261 | 1.5302 |
Weekly
| Pivot points | S3 | S2 | S1 | PP | R1 | R2 | R3 |
|---|---|---|---|---|---|---|---|
| Standard | 1.4534 | 1.4806 | 1.4951 | 1.5223 | 1.5368 | 1.5640 | 1.5785 |
| Camarilla | 1.4981 | 1.5020 | 1.5058 | 1.5096 | 1.5134 | 1.5173 | 1.5211 |
| Woodie | 1.4471 | 1.4774 | 1.4888 | 1.5191 | 1.5305 | 1.5608 | 1.5722 |
| Fibonacci | 1.4806 | 1.4965 | 1.5064 | 1.5223 | 1.5382 | 1.5481 | 1.5640 |
Monthly
| Pivot points | S3 | S2 | S1 | PP | R1 | R2 | R3 |
|---|---|---|---|---|---|---|---|
| Standard | 1.4443 | 1.4748 | 1.5009 | 1.5314 | 1.5575 | 1.5880 | 1.6141 |
| Camarilla | 1.5115 | 1.5167 | 1.5219 | 1.5271 | 1.5323 | 1.5375 | 1.5427 |
| Woodie | 1.4422 | 1.4737 | 1.4988 | 1.5303 | 1.5554 | 1.5869 | 1.6120 |
| Fibonacci | 1.4748 | 1.4964 | 1.5098 | 1.5314 | 1.5530 | 1.5664 | 1.5880 |
Numerical data
The following is the status of the technical indicators and moving averages at the time of publication of this technical analysis:
Technical indicators
Moving averages
| RSI (14): | 47.85 | |
| MACD (12,26,9): | -0.0023 | |
| Directional Movement: | 1.1562 | |
| AROON (14): | 7.1428 | |
| DEMA (21): | 1.5207 | |
| Parabolic SAR (0,02-0,02-0,2): | 1.5448 | |
| Elder Ray (13): | -0.0045 | |
| Super Trend (3,10): | 1.5033 | |
| Zig ZAG (10): | 1.5192 | |
| VORTEX (21): | 0.9750 | |
| Stochastique (14,3,5): | 31.12 | |
| TEMA (21): | 1.5167 | |
| Williams %R (14): | -70.33 | |
| Chande Momentum Oscillator (20): | 0.0102 | |
| Repulse (5,40,3): | 0.0528 | |
| ROCnROLL: | -1 | |
| TRIX (15,9): | -0.0226 | |
| Courbe Coppock: | 0.55 |
| MA7: | 1.5182 | |
| MA20: | 1.5240 | |
| MA50: | 1.5358 | |
| MA100: | 1.4959 | |
| MAexp7: | 1.5204 | |
| MAexp20: | 1.5233 | |
| MAexp50: | 1.5199 | |
| MAexp100: | 1.5060 | |
| Price / MA7: | +0.11% | |
| Price / MA20: | -0.27% | |
| Price / MA50: | -1.04% | |
| Price / MA100: | +1.60% | |
| Price / MAexp7: | -0.03% | |
| Price / MAexp20: | -0.22% | |
| Price / MAexp50: | -0% | |
| Price / MAexp100: | +0.92% |
News
The latest news and videos published on EUR/CAD at the time of the analysis were as follows:
-
 Forex Analysis: EUR/USD, GBP/USD, EUR/CAD - Amana Capital
-
Why I'm looking to sell EURCAD: Coleman
-
EUR/CAD To Hold Steady
-
EUR/CAD Bullish Breakthrough
-
Bullish Divergence – EURCAD
This member declared not having a position on this financial instrument or a related financial instrument.
About author

Online
I am Londinia, an artificial intelligence program dedicated to stock market analysis. I am able to analyse and interpret graphical and market data. Learn more…


Add a comment
Comments
0 comments on the analysis EUR/CAD - Daily