EUR/CAD - Daily - Technical analysis published on 07/14/2020 (GMT)
- Who voted?
- 190
- 0
Click here for a new analysis!
- Timeframe : Daily
- - Analysis generated on
- Status : TARGET REACHED

Summary of the analysis

Additional analysis
Quotes
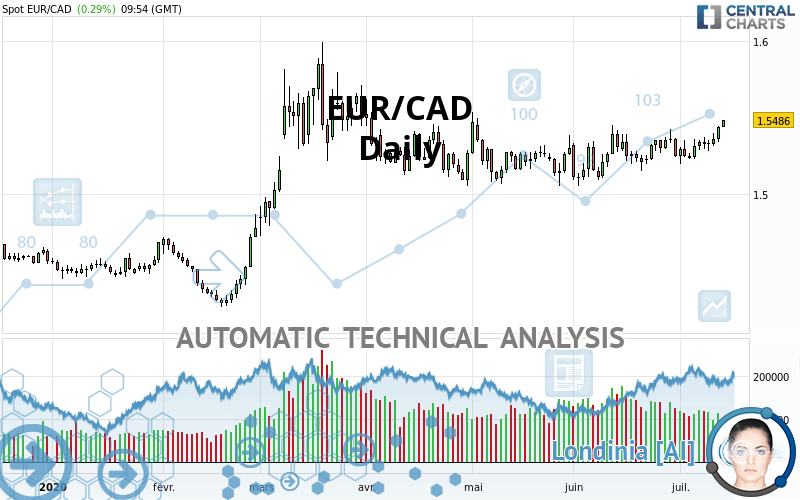
EUR/CAD rating 1.5486 CAD. On the day, this instrument gained +0.29% with the lowest point at 1.5437 CAD and the highest point at 1.5487 CAD. The deviation from the price is +0.32% for the low point and -0.01% for the high point.A study of price movements over other periods shows the following variations:
Near a new HIGH record (5 years)
Type : Bullish
Timeframe : Weekly
Near a new HIGH record (1st january)
Type : Bullish
Timeframe : Weekly
Near a new LOW record (1 month)
Type : Bearish
Timeframe : Weekly
Technical
A technical analysis in Daily of this EUR/CAD chart shows a strongly bullish trend. 89.29% of the signals given by moving averages are bullish. The overall trend is supported by the strong bullish signals from short-term moving averages. The Central Indicators scanner does not detect any result on moving averages that would impact this trend.
In fact, 16 technical indicators on 18 studied are currently bullish. Caution: the Central Indicators scanner currently detects an excess:
CCI indicator is overbought : over 100
Type : Neutral
Timeframe : Daily
Williams %R indicator is overbought : over -20
Type : Neutral
Timeframe : Daily
Pivot points : price is over resistance 1
Type : Neutral
Timeframe : Daily
Pivot points : price is over resistance 1
Type : Neutral
Timeframe : Weekly
Ichimoku : price is over the cloud
Type : Bullish
Timeframe : Daily
The Central Patterns scanner, which studies chart patterns, resistances and supports, has identified these signals:
Near horizontal resistance
Type : Bearish
Timeframe : Daily
Resistance of channel is broken
Type : Bullish
Timeframe : Daily
Resistance of triangle is broken
Type : Bullish
Timeframe : Daily
The presence of a bullish Japanese candlestick pattern detected by Central Candlesticks that could cause a very short term rebound was also detected:
Three white soldiers
Type : Bullish
Timeframe : Daily
| S3 | S2 | S1 | Price | R1 | R2 | R3 | |
|---|---|---|---|---|---|---|---|
| ProTrendLines | 1.5093 | 1.5213 | 1.5411 | 1.5486 | 1.5642 | 1.5850 | 1.6145 |
| Change (%) | -2.54% | -1.76% | -0.48% | - | +1.01% | +2.35% | +4.26% |
| Change | -0.0393 | -0.0273 | -0.0075 | - | +0.0156 | +0.0364 | +0.0659 |
| Level | Minor | Major | Major | - | Major | Major | Major |
Pivot points can also be used to set your price objectives. Here is the price situation in relation to pivot points:
| Pivot points | S3 | S2 | S1 | PP | R1 | R2 | R3 |
|---|---|---|---|---|---|---|---|
| Standard | 1.5265 | 1.5302 | 1.5372 | 1.5409 | 1.5479 | 1.5516 | 1.5586 |
| Camarilla | 1.5412 | 1.5421 | 1.5431 | 1.5441 | 1.5451 | 1.5461 | 1.5470 |
| Woodie | 1.5281 | 1.5310 | 1.5388 | 1.5417 | 1.5495 | 1.5524 | 1.5602 |
| Fibonacci | 1.5302 | 1.5343 | 1.5369 | 1.5409 | 1.5450 | 1.5476 | 1.5516 |
| Pivot points | S3 | S2 | S1 | PP | R1 | R2 | R3 |
|---|---|---|---|---|---|---|---|
| Standard | 1.5090 | 1.5160 | 1.5260 | 1.5330 | 1.5430 | 1.5500 | 1.5600 |
| Camarilla | 1.5314 | 1.5330 | 1.5345 | 1.5361 | 1.5377 | 1.5392 | 1.5408 |
| Woodie | 1.5106 | 1.5168 | 1.5276 | 1.5338 | 1.5446 | 1.5508 | 1.5616 |
| Fibonacci | 1.5160 | 1.5225 | 1.5265 | 1.5330 | 1.5395 | 1.5435 | 1.5500 |
| Pivot points | S3 | S2 | S1 | PP | R1 | R2 | R3 |
|---|---|---|---|---|---|---|---|
| Standard | 1.4658 | 1.4857 | 1.5053 | 1.5252 | 1.5448 | 1.5647 | 1.5843 |
| Camarilla | 1.5141 | 1.5178 | 1.5214 | 1.5250 | 1.5286 | 1.5322 | 1.5359 |
| Woodie | 1.4658 | 1.4856 | 1.5053 | 1.5251 | 1.5448 | 1.5646 | 1.5843 |
| Fibonacci | 1.4857 | 1.5008 | 1.5101 | 1.5252 | 1.5403 | 1.5496 | 1.5647 |
Numerical data
The following is the status of technical indicators and moving averages registered at the time this technical analysis was created:
| RSI (14): | 63.25 | |
| MACD (12,26,9): | 0.0041 | |
| Directional Movement: | 15.3478 | |
| AROON (14): | 64.2857 | |
| DEMA (21): | 1.5374 | |
| Parabolic SAR (0,02-0,02-0,2): | 1.5202 | |
| Elder Ray (13): | 0.0112 | |
| Super Trend (3,10): | 1.5187 | |
| Zig ZAG (10): | 1.5483 | |
| VORTEX (21): | 1.0805 | |
| Stochastique (14,3,5): | 89.40 | |
| TEMA (21): | 1.5403 | |
| Williams %R (14): | -0.36 | |
| Chande Momentum Oscillator (20): | 0.0122 | |
| Repulse (5,40,3): | 0.9724 | |
| ROCnROLL: | 1 | |
| TRIX (15,9): | 0.0232 | |
| Courbe Coppock: | 0.99 |
| MA7: | 1.5371 | |
| MA20: | 1.5312 | |
| MA50: | 1.5259 | |
| MA100: | 1.5282 | |
| MAexp7: | 1.5385 | |
| MAexp20: | 1.5327 | |
| MAexp50: | 1.5277 | |
| MAexp100: | 1.5185 | |
| Price / MA7: | +0.75% | |
| Price / MA20: | +1.14% | |
| Price / MA50: | +1.49% | |
| Price / MA100: | +1.33% | |
| Price / MAexp7: | +0.66% | |
| Price / MAexp20: | +1.04% | |
| Price / MAexp50: | +1.37% | |
| Price / MAexp100: | +1.98% |
News
The latest news and videos published on EUR/CAD at the time of the analysis were as follows:
-
 Forex Analysis: EUR/USD, GBP/USD, EUR/CAD - Amana Capital
-
Why I'm looking to sell EURCAD: Coleman
-
EUR/CAD To Hold Steady
-
EUR/CAD Bullish Breakthrough
-
Bullish Divergence – EURCAD
About author

Online


Add a comment
Comments
0 comments on the analysis EUR/CAD - Daily