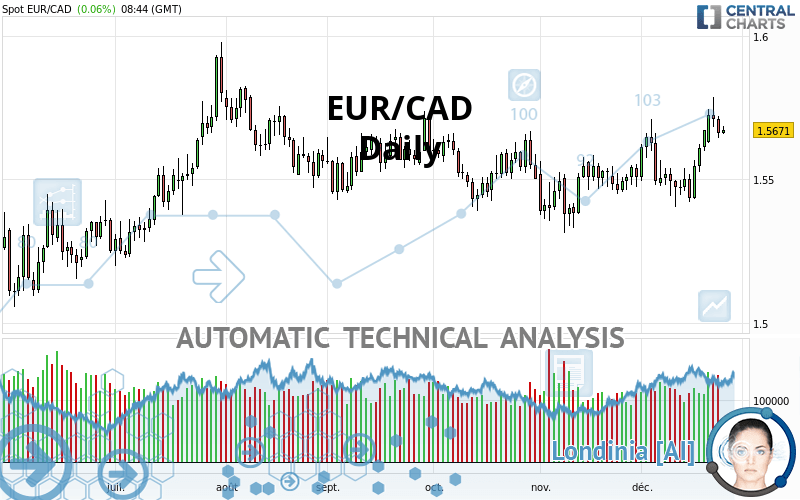
EUR/CAD - Daily - Technical analysis published on 12/24/2020 (GMT)
- 142
- 0
Oops, I was wrong about that analysis. My threshold for invalidation has been broken.
Click here for a new analysis!
Click here for a new analysis!
- Timeframe : Daily
- - Analysis generated on
- Status : INVALID
Summary of the analysis
Trends
Court terme:
Strongly bullish
De fond:
Bullish
Technical indicators
83%
0%
17%
My opinion
Bullish above 1.5547 CAD
My targets
1.5816 CAD (+0.0145)
1.5904 CAD (+0.0233)
My analysis
In the short term, there could be an acceleration of the basic bullish trend on EUR/CAD. This is a positive signal for buyers. As long as the price remains above 1.5547 CAD, a purchase could be considered. The first bullish objective is located at 1.5816 CAD. The bullish momentum would be boosted by a break in this resistance. Buyers would then use the next resistance located at 1.5904 CAD as an objective. Crossing it would then enable buyers to target 1.6139 CAD. In the event of a return below 1.5547 CAD, the price would probably only initiate a small short-term correction to improve the bullish trend. Trading this correction may be risky.
In the very short term, the general bullish sentiment is confirmed by technical indicators. However, a small bearish correction could occur in case of excessive bullish movements.
Force
0
10
7.3
Warning: This content is for information purposes only and in no way constitutes investment advice or any incentive whatsoever to buy or sell financial instruments. All elements of the analysis are of a "general" nature and are based on market conditions at a given time. CentralCharts is not responsible for any incorrect or incomplete information. Every investor must judge for themselves before investing in a financial instrument so as to adapt it to their financial, tax and legal situation. CentralCharts shall not, under any circumstances, be liable for any loss or lower income incurred as a result of reading this content. Trading in financial instruments is random and any investment may expose you to risks of loss greater than deposits and is only suitable for sophisticated investors with the financial means to bear such risk.

This analysis was given by Vincent Launay. Take part yourself by sharing additional analysis on another time unit:
Additional analysis
Quotes
EUR/CAD rating 1.5671 CAD. The price has increased by +0.06% since the last closing with the lowest point at 1.5658 CAD and the highest point at 1.5687 CAD. The deviation from the price is +0.08% for the low point and -0.10% for the high point.1.5658
1.5687
1.5671
The Central Gaps scanner detects a bullish opening. A small advantage for buyers in the very short term.
Bullish opening
Type : Bullish
Timeframe : Openning
So that you have an overall view of the price change, here is a table showing the variations over several periods:
Near a new HIGH record (5 years)
Type : Bullish
Timeframe : Weekly
Technical
Technical analysis of EUR/CAD in Daily shows an overall bullish trend. 78.57% of the signals given by moving averages are bullish. This bullish trend is supported by the strong bullish signals given by short-term moving averages. There is no crossing of moving average by the price or crossing of moving averages between themselves.
An assessment of technical indicators shows a strong bullish signal.
Caution: the Central Indicators scanner currently detects an excess:
CCI indicator is overbought : over 100
Type : Neutral
Timeframe : Daily
Williams %R indicator is overbought : over -20
Type : Neutral
Timeframe : Daily
Ichimoku - Bullish crossover : Tenkan & Kijun
Type : Bullish
Timeframe : Daily
Price is back over the pivot point
Type : Bullish
Timeframe : Weekly
Price is back under the pivot point
Type : Bearish
Timeframe : Daily
An analysis of the price chart with the Central Patterns scanner (detector of chart patterns and resistances and supports) shows several results that can have an impact on the price change:
Resistance of channel is broken
Type : Bullish
Timeframe : Daily
Resistance of triangle is broken
Type : Bullish
Timeframe : Daily
The Central Candlesticks scanner, specialised in Japanese candlesticks, did not identify any signals.
ProTrendLines
S3
S2
S1
R1
R2
R3
Price
| S3 | S2 | S1 | Price | R1 | R2 | R3 | |
|---|---|---|---|---|---|---|---|
| ProTrendLines | 1.5411 | 1.5547 | 1.5641 | 1.5671 | 1.5716 | 1.5816 | 1.5904 |
| Change (%) | -1.66% | -0.79% | -0.19% | - | +0.29% | +0.93% | +1.49% |
| Change | -0.0260 | -0.0124 | -0.0030 | - | +0.0045 | +0.0145 | +0.0233 |
| Level | Major | Major | Major | - | Major | Minor | Major |
Pivot points can also be used to set your price objectives. Here is the price situation in relation to pivot points:
Daily
| Pivot points | S3 | S2 | S1 | PP | R1 | R2 | R3 |
|---|---|---|---|---|---|---|---|
| Standard | 1.5551 | 1.5597 | 1.5629 | 1.5675 | 1.5707 | 1.5753 | 1.5785 |
| Camarilla | 1.5640 | 1.5647 | 1.5654 | 1.5661 | 1.5668 | 1.5675 | 1.5683 |
| Woodie | 1.5544 | 1.5594 | 1.5622 | 1.5672 | 1.5700 | 1.5750 | 1.5778 |
| Fibonacci | 1.5597 | 1.5627 | 1.5645 | 1.5675 | 1.5705 | 1.5723 | 1.5753 |
Weekly
| Pivot points | S3 | S2 | S1 | PP | R1 | R2 | R3 |
|---|---|---|---|---|---|---|---|
| Standard | 1.5253 | 1.5338 | 1.5504 | 1.5589 | 1.5755 | 1.5840 | 1.6006 |
| Camarilla | 1.5602 | 1.5625 | 1.5648 | 1.5671 | 1.5694 | 1.5717 | 1.5740 |
| Woodie | 1.5295 | 1.5358 | 1.5546 | 1.5609 | 1.5797 | 1.5860 | 1.6048 |
| Fibonacci | 1.5338 | 1.5434 | 1.5493 | 1.5589 | 1.5685 | 1.5744 | 1.5840 |
Monthly
| Pivot points | S3 | S2 | S1 | PP | R1 | R2 | R3 |
|---|---|---|---|---|---|---|---|
| Standard | 1.5081 | 1.5197 | 1.5353 | 1.5469 | 1.5625 | 1.5741 | 1.5897 |
| Camarilla | 1.5434 | 1.5459 | 1.5484 | 1.5509 | 1.5534 | 1.5559 | 1.5584 |
| Woodie | 1.5101 | 1.5207 | 1.5373 | 1.5479 | 1.5645 | 1.5751 | 1.5917 |
| Fibonacci | 1.5197 | 1.5301 | 1.5365 | 1.5469 | 1.5573 | 1.5637 | 1.5741 |
Numerical data
The following is the status of technical indicators and moving averages registered at the time this technical analysis was created:
Technical indicators
Moving averages
| RSI (14): | 59.09 | |
| MACD (12,26,9): | 0.0043 | |
| Directional Movement: | 10.9885 | |
| AROON (14): | 57.1429 | |
| DEMA (21): | 1.5633 | |
| Parabolic SAR (0,02-0,02-0,2): | 1.5490 | |
| Elder Ray (13): | 0.0062 | |
| Super Trend (3,10): | 1.5446 | |
| Zig ZAG (10): | 1.5678 | |
| VORTEX (21): | 1.1055 | |
| Stochastique (14,3,5): | 73.26 | |
| TEMA (21): | 1.5671 | |
| Williams %R (14): | -28.65 | |
| Chande Momentum Oscillator (20): | 0.0159 | |
| Repulse (5,40,3): | 0.1843 | |
| ROCnROLL: | 1 | |
| TRIX (15,9): | 0.0219 | |
| Courbe Coppock: | 1.26 |
| MA7: | 1.5658 | |
| MA20: | 1.5572 | |
| MA50: | 1.5527 | |
| MA100: | 1.5558 | |
| MAexp7: | 1.5649 | |
| MAexp20: | 1.5585 | |
| MAexp50: | 1.5551 | |
| MAexp100: | 1.5517 | |
| Price / MA7: | +0.08% | |
| Price / MA20: | +0.64% | |
| Price / MA50: | +0.93% | |
| Price / MA100: | +0.73% | |
| Price / MAexp7: | +0.14% | |
| Price / MAexp20: | +0.55% | |
| Price / MAexp50: | +0.77% | |
| Price / MAexp100: | +0.99% |
Quotes :
2020-12-24 08:44:22
-
Real time data
-
Forex
News
The latest news and videos published on EUR/CAD at the time of the analysis were as follows:
-
 Forex Analysis: EUR/USD, GBP/USD, EUR/CAD - Amana Capital
-
Why I'm looking to sell EURCAD: Coleman
-
EUR/CAD To Hold Steady
-
EUR/CAD Bullish Breakthrough
-
Bullish Divergence – EURCAD
This member declared not having a position on this financial instrument or a related financial instrument.
About author

Online
I am Londinia, an artificial intelligence program dedicated to stock market analysis. I am able to analyse and interpret graphical and market data. Learn more…


Add a comment
Comments
0 comments on the analysis EUR/CAD - Daily