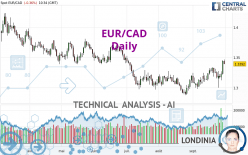
EUR/CAD - Daily - Technical analysis published on 09/30/2022 (GMT)
- 166
- 0
Click here for a new analysis!
- Timeframe : Daily
- - Analysis generated on
- Status : TARGET REACHED

Summary of the analysis

Additional analysis
Quotes
The EUR/CAD price is 1.3392 CAD. The price registered a decrease of -0.37% on the session with the lowest point at 1.3387 CAD and the highest point at 1.3465 CAD. The deviation from the price is +0.04% for the low point and -0.54% for the high point.A bullish opening was detected by the Central Gaps scanner. Buyers are trying to impose a bullish momentum in the very short term.
Bullish opening
Type : Bullish
Timeframe : Openning
Here is a more detailed summary of the historical variations registered by EUR/CAD:
Near a new LOW record (5 years)
Type : Bearish
Timeframe : Weekly
Near a new LOW record (1 year)
Type : Bearish
Timeframe : Weekly
Near a new LOW record (1st january)
Type : Bearish
Timeframe : Weekly
New HIGH record (1 month)
Type : Bullish
Timeframe : Weekly
Technical
Technical analysis of EUR/CAD in Daily shows an overall bullish trend. 67.86% of the signals given by moving averages are bullish. The overall trend is reinforced by the strong bullish signals from short-term moving averages. An assessment of moving averages reveals several bullish signals that could impact this trend:
Bullish trend reversal : adaptative moving average 100
Type : Bullish
Timeframe : Daily
Moving Average bullish crossovers : AMA20 & AMA50
Type : Bullish
Timeframe : Daily
An assessment of technical indicators shows a strong bullish signal.
But beware of excesses. The Central Indicators scanner currently detects this:
CCI indicator is overbought : over 100
Type : Neutral
Timeframe : Daily
Previous candle closed over Bollinger bands
Type : Neutral
Timeframe : Daily
RSI indicator: bearish divergence
Type : Bearish
Timeframe : Daily
Williams %R indicator is overbought : over -20
Type : Neutral
Timeframe : Daily
Pivot points : price is over resistance 2
Type : Neutral
Timeframe : Weekly
An analysis of the price chart with the Central Patterns scanner (detector of chart patterns and resistances and supports) shows several results that can have an impact on the price change:
Near horizontal resistance
Type : Bearish
Timeframe : Daily
Resistance of channel is broken
Type : Bullish
Timeframe : Daily
The presence of a bearish pattern in Japanese candlesticks detected by Central Candlesticks that could cause a correction in the very short term was also detected:
Bearish doji star
Type : Bearish
Timeframe : Daily
| S3 | S2 | S1 | Price | R1 | R2 | R3 | |
|---|---|---|---|---|---|---|---|
| ProTrendLines | 1.2497 | 1.2901 | 1.3129 | 1.3392 | 1.3414 | 1.3695 | 1.4142 |
| Change (%) | -6.68% | -3.67% | -1.96% | - | +0.16% | +2.26% | +5.60% |
| Change | -0.0895 | -0.0491 | -0.0263 | - | +0.0022 | +0.0303 | +0.0750 |
| Level | Intermediate | Major | Major | - | Intermediate | Intermediate | Minor |
To determine price objectives, it is also possible to use the pivot points. Here is the price position in relation to pivot points:
| Pivot points | S3 | S2 | S1 | PP | R1 | R2 | R3 |
|---|---|---|---|---|---|---|---|
| Standard | 1.3047 | 1.3132 | 1.3286 | 1.3371 | 1.3525 | 1.3610 | 1.3764 |
| Camarilla | 1.3375 | 1.3397 | 1.3419 | 1.3441 | 1.3463 | 1.3485 | 1.3507 |
| Woodie | 1.3083 | 1.3149 | 1.3322 | 1.3388 | 1.3561 | 1.3627 | 1.3800 |
| Fibonacci | 1.3132 | 1.3223 | 1.3279 | 1.3371 | 1.3462 | 1.3518 | 1.3610 |
| Pivot points | S3 | S2 | S1 | PP | R1 | R2 | R3 |
|---|---|---|---|---|---|---|---|
| Standard | 1.2920 | 1.3035 | 1.3104 | 1.3219 | 1.3288 | 1.3403 | 1.3472 |
| Camarilla | 1.3121 | 1.3138 | 1.3155 | 1.3172 | 1.3189 | 1.3206 | 1.3223 |
| Woodie | 1.2896 | 1.3024 | 1.3080 | 1.3208 | 1.3264 | 1.3392 | 1.3448 |
| Fibonacci | 1.3035 | 1.3106 | 1.3149 | 1.3219 | 1.3290 | 1.3333 | 1.3403 |
| Pivot points | S3 | S2 | S1 | PP | R1 | R2 | R3 |
|---|---|---|---|---|---|---|---|
| Standard | 1.2557 | 1.2716 | 1.2955 | 1.3114 | 1.3353 | 1.3512 | 1.3751 |
| Camarilla | 1.3084 | 1.3120 | 1.3157 | 1.3193 | 1.3230 | 1.3266 | 1.3303 |
| Woodie | 1.2596 | 1.2736 | 1.2994 | 1.3134 | 1.3392 | 1.3532 | 1.3790 |
| Fibonacci | 1.2716 | 1.2868 | 1.2962 | 1.3114 | 1.3266 | 1.3360 | 1.3512 |
Numerical data
The following is the status of technical indicators and moving averages registered at the time this technical analysis was created:
| RSI (14): | 64.04 | |
| MACD (12,26,9): | 0.0058 | |
| Directional Movement: | 8.5179 | |
| AROON (14): | 28.5714 | |
| DEMA (21): | 1.3290 | |
| Parabolic SAR (0,02-0,02-0,2): | 1.3010 | |
| Elder Ray (13): | 0.0175 | |
| Super Trend (3,10): | 1.3051 | |
| Zig ZAG (10): | 1.3400 | |
| VORTEX (21): | 1.1230 | |
| Stochastique (14,3,5): | 83.72 | |
| TEMA (21): | 1.3345 | |
| Williams %R (14): | -13.79 | |
| Chande Momentum Oscillator (20): | 0.0262 | |
| Repulse (5,40,3): | 1.1184 | |
| ROCnROLL: | 1 | |
| TRIX (15,9): | 0.0464 | |
| Courbe Coppock: | 2.58 |
| MA7: | 1.3266 | |
| MA20: | 1.3203 | |
| MA50: | 1.3130 | |
| MA100: | 1.3287 | |
| MAexp7: | 1.3302 | |
| MAexp20: | 1.3224 | |
| MAexp50: | 1.3200 | |
| MAexp100: | 1.3313 | |
| Price / MA7: | +0.95% | |
| Price / MA20: | +1.43% | |
| Price / MA50: | +2.00% | |
| Price / MA100: | +0.79% | |
| Price / MAexp7: | +0.68% | |
| Price / MAexp20: | +1.27% | |
| Price / MAexp50: | +1.45% | |
| Price / MAexp100: | +0.59% |
News
Don't forget to follow the news on EUR/CAD. At the time of publication of this analysis, the latest news was as follows:
-
 Forex Analysis: EUR/USD, GBP/USD, EUR/CAD - Amana Capital
-
Why I'm looking to sell EURCAD: Coleman
-
EUR/CAD To Hold Steady
-
EUR/CAD Bullish Breakthrough
-
Bullish Divergence – EURCAD
About author

Online


Add a comment
Comments
0 comments on the analysis EUR/CAD - Daily