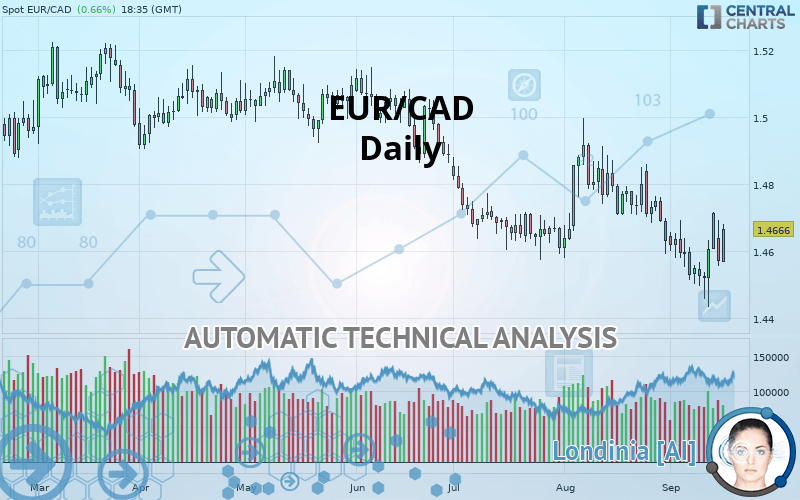
EUR/CAD - Daily - Technical analysis published on 09/17/2019 (GMT)
- Who voted?
- 187
- 0
Click here for a new analysis!
- Timeframe : Daily
- - Analysis generated on
- Status : TARGET REACHED

Summary of the analysis

Additional analysis
Quotes
The EUR/CAD rating is 1.4666 CAD. The price has increased by +0.66% since the last closing and was between 1.4567 CAD and 1.4682 CAD. This implies that the price is at +0.68% from its lowest and at -0.11% from its highest.A bearish opening was detected by the Central Gaps scanner. Sellers are trying to impose a bearish trend in the very short term.
Bearish opening
Type : Bearish
Timeframe : Openning
A study of price movements over other periods shows the following variations:
Near a new LOW record (1st january)
Type : Bearish
Timeframe : Weekly
Technical
A technical analysis in Daily of this EUR/CAD chart shows a bearish trend. 75% of the signals given by moving averages are bearish. Caution: as the signals currently given by short-term moving averages are rather neutral, the bearish trend could slow down. The Central Indicators market scanner is currently detecting several bearish signals that could impact this trend:
Bearish price crossover with Moving Average 20
Type : Bearish
Timeframe : Daily
Bearish price crossover with Moving Average 50
Type : Bearish
Timeframe : Daily
Bearish price crossover with adaptative moving average 20
Type : Bearish
Timeframe : Daily
The technical indicators are bullish. There is still some doubt about the price increase.
Caution: the Central Indicators scanner currently detects an excess:
Williams %R indicator is overbought : over -20
Type : Neutral
Timeframe : Daily
Pivot points : price is over resistance 1
Type : Neutral
Timeframe : Daily
RSI indicator is back under 50
Type : Bearish
Timeframe : Daily
Price is back over the pivot point
Type : Bullish
Timeframe : Weekly
Price is back under the pivot point
Type : Bearish
Timeframe : Daily
Williams %R indicator is back under -50
Type : Bearish
Timeframe : Daily
The analysis of the price chart with Central Patterns scanners does not return any result.
The Central Candlesticks scanner which studies Japanese candlesticks did not detect anything.
| S3 | S2 | S1 | Price | R1 | R2 | R3 | |
|---|---|---|---|---|---|---|---|
| ProTrendLines | 1.3828 | 1.4316 | 1.4609 | 1.4666 | 1.4783 | 1.4918 | 1.5066 |
| Change (%) | -5.71% | -2.39% | -0.39% | - | +0.80% | +1.72% | +2.73% |
| Change | -0.0838 | -0.0350 | -0.0057 | - | +0.0117 | +0.0252 | +0.0400 |
| Level | Intermediate | Major | Major | - | Major | Major | Minor |
To determine price objectives, it is also possible to use the pivot points. Here is the price position in relation to pivot points:
| Pivot points | S3 | S2 | S1 | PP | R1 | R2 | R3 |
|---|---|---|---|---|---|---|---|
| Standard | 1.4459 | 1.4507 | 1.4539 | 1.4587 | 1.4619 | 1.4667 | 1.4699 |
| Camarilla | 1.4548 | 1.4555 | 1.4563 | 1.4570 | 1.4577 | 1.4585 | 1.4592 |
| Woodie | 1.4450 | 1.4503 | 1.4530 | 1.4583 | 1.4610 | 1.4663 | 1.4690 |
| Fibonacci | 1.4507 | 1.4538 | 1.4557 | 1.4587 | 1.4618 | 1.4637 | 1.4667 |
| Pivot points | S3 | S2 | S1 | PP | R1 | R2 | R3 |
|---|---|---|---|---|---|---|---|
| Standard | 1.4245 | 1.4339 | 1.4527 | 1.4621 | 1.4809 | 1.4903 | 1.5091 |
| Camarilla | 1.4636 | 1.4662 | 1.4688 | 1.4714 | 1.4740 | 1.4766 | 1.4792 |
| Woodie | 1.4291 | 1.4363 | 1.4573 | 1.4645 | 1.4855 | 1.4927 | 1.5137 |
| Fibonacci | 1.4339 | 1.4447 | 1.4514 | 1.4621 | 1.4729 | 1.4796 | 1.4903 |
| Pivot points | S3 | S2 | S1 | PP | R1 | R2 | R3 |
|---|---|---|---|---|---|---|---|
| Standard | 1.4059 | 1.4319 | 1.4475 | 1.4735 | 1.4891 | 1.5151 | 1.5307 |
| Camarilla | 1.4516 | 1.4554 | 1.4592 | 1.4630 | 1.4668 | 1.4706 | 1.4744 |
| Woodie | 1.4006 | 1.4293 | 1.4422 | 1.4709 | 1.4838 | 1.5125 | 1.5254 |
| Fibonacci | 1.4319 | 1.4478 | 1.4576 | 1.4735 | 1.4894 | 1.4992 | 1.5151 |
Numerical data
The following is the status of technical indicators and moving averages registered at the time this technical analysis was created:
| RSI (14): | 50.49 | |
| MACD (12,26,9): | -0.0036 | |
| Directional Movement: | 3.9986 | |
| AROON (14): | -78.5714 | |
| DEMA (21): | 1.4592 | |
| Parabolic SAR (0,02-0,02-0,2): | 1.4445 | |
| Elder Ray (13): | 0.0002 | |
| Super Trend (3,10): | 1.4751 | |
| Zig ZAG (10): | 1.4668 | |
| VORTEX (21): | 0.8900 | |
| Stochastique (14,3,5): | 65.55 | |
| TEMA (21): | 1.4585 | |
| Williams %R (14): | -28.66 | |
| Chande Momentum Oscillator (20): | 0.0038 | |
| Repulse (5,40,3): | 1.2349 | |
| ROCnROLL: | -1 | |
| TRIX (15,9): | -0.0413 | |
| Courbe Coppock: | 1.64 |
| MA7: | 1.4594 | |
| MA20: | 1.4646 | |
| MA50: | 1.4694 | |
| MA100: | 1.4843 | |
| MAexp7: | 1.4617 | |
| MAexp20: | 1.4641 | |
| MAexp50: | 1.4711 | |
| MAexp100: | 1.4803 | |
| Price / MA7: | +0.49% | |
| Price / MA20: | +0.14% | |
| Price / MA50: | -0.19% | |
| Price / MA100: | -1.19% | |
| Price / MAexp7: | +0.34% | |
| Price / MAexp20: | +0.17% | |
| Price / MAexp50: | -0.31% | |
| Price / MAexp100: | -0.93% |
News
The latest news and videos published on EUR/CAD at the time of the analysis were as follows:
-
 Forex Analysis: EUR/USD, GBP/USD, EUR/CAD - Amana Capital
-
Why I'm looking to sell EURCAD: Coleman
-
EUR/CAD To Hold Steady
-
EUR/CAD Bullish Breakthrough
-
Bullish Divergence – EURCAD
About author

Online


Add a comment
Comments
0 comments on the analysis EUR/CAD - Daily