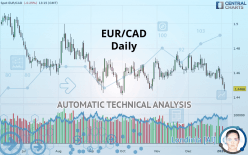
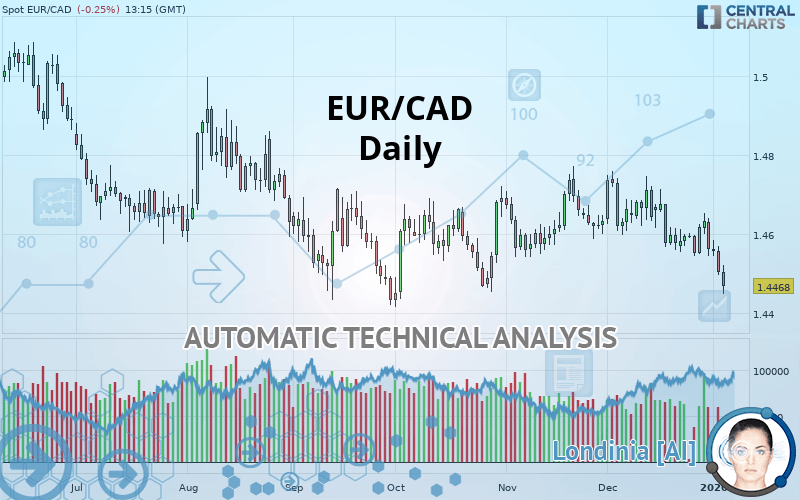
EUR/CAD - Daily - Technical analysis published on 01/03/2020 (GMT)
- Who voted?
- 269
- 0
Click here for a new analysis!
- Timeframe : Daily
- - Analysis generated on
- Status : LEVEL MAINTAINED
Summary of the analysis

Additional analysis
Quotes
EUR/CAD rating 1.4468 CAD. The price registered a decrease of -0.25% on the session with the lowest point at 1.4449 CAD and the highest point at 1.4522 CAD. The deviation from the price is +0.13% for the low point and -0.37% for the high point.The Central Gaps scanner detects a bullish opening. A small advantage for buyers in the very short term.
Bullish opening
Type : Bullish
Timeframe : Openning
A study of price movements over other periods shows the following variations:
Near a new HIGH record (1st january)
Type : Bullish
Timeframe : Weekly
Near a new HIGH record (1 month)
Type : Bullish
Timeframe : Weekly
Technical
A technical analysis in Daily of this EUR/CAD chart shows a sharp bearish trend. The signals given by moving averages are 82.14% bearish. This strong bearish trend is confirmed by the strong signals currently being given by short-term moving averages. The Central Indicators scanner detects bullish and bearish signals on moving averages that could impact this trend:
Moving Average bearish crossovers : MA20 & MA50
Type : Bearish
Timeframe : Daily
Moving Average bullish crossovers : MA50 & MA100
Type : Bullish
Timeframe : Daily
An assessment of technical indicators shows a bearish signal.
Caution: the Central Indicators scanner currently detects an excess:
CCI indicator is oversold : under -100
Type : Neutral
Timeframe : Daily
Williams %R indicator is oversold : under -80
Type : Neutral
Timeframe : Daily
Pivot points : price is under support 1
Type : Neutral
Timeframe : Daily
Pivot points : price is under support 3
Type : Neutral
Timeframe : Weekly
SuperTrend indicator bearish reversal
Type : Bearish
Timeframe : Daily
Price is back over the pivot point
Type : Bullish
Timeframe : Weekly
Central Patterns, the market scanner focusing on chart patterns, resistances and supports found these results:
Horizontal resistance is broken
Type : Bullish
Timeframe : Daily
Support of channel is broken
Type : Bearish
Timeframe : Daily
Support of triangle is broken
Type : Bearish
Timeframe : Daily
The Central Candlesticks scanner, specialised in Japanese candlesticks, did not identify any signals.
| S3 | S2 | S1 | Price | R1 | R2 | R3 | |
|---|---|---|---|---|---|---|---|
| ProTrendLines | 1.4118 | 1.4316 | 1.4433 | 1.4468 | 1.4609 | 1.4712 | 1.4783 |
| Change (%) | -2.42% | -1.05% | -0.24% | - | +0.97% | +1.69% | +2.18% |
| Change | -0.0350 | -0.0152 | -0.0035 | - | +0.0141 | +0.0244 | +0.0315 |
| Level | Minor | Intermediate | Intermediate | - | Major | Major | Major |
Pivot points can also be used to set your price objectives. Here is the price situation in relation to pivot points:
| Pivot points | S3 | S2 | S1 | PP | R1 | R2 | R3 |
|---|---|---|---|---|---|---|---|
| Standard | 1.4404 | 1.4451 | 1.4477 | 1.4524 | 1.4550 | 1.4597 | 1.4623 |
| Camarilla | 1.4484 | 1.4491 | 1.4497 | 1.4504 | 1.4511 | 1.4517 | 1.4524 |
| Woodie | 1.4395 | 1.4446 | 1.4468 | 1.4519 | 1.4541 | 1.4592 | 1.4614 |
| Fibonacci | 1.4451 | 1.4479 | 1.4496 | 1.4524 | 1.4552 | 1.4569 | 1.4597 |
| Pivot points | S3 | S2 | S1 | PP | R1 | R2 | R3 |
|---|---|---|---|---|---|---|---|
| Standard | 1.4485 | 1.4515 | 1.4566 | 1.4596 | 1.4647 | 1.4677 | 1.4728 |
| Camarilla | 1.4596 | 1.4603 | 1.4611 | 1.4618 | 1.4625 | 1.4633 | 1.4640 |
| Woodie | 1.4497 | 1.4520 | 1.4578 | 1.4601 | 1.4659 | 1.4682 | 1.4740 |
| Fibonacci | 1.4515 | 1.4546 | 1.4565 | 1.4596 | 1.4627 | 1.4646 | 1.4677 |
| Pivot points | S3 | S2 | S1 | PP | R1 | R2 | R3 |
|---|---|---|---|---|---|---|---|
| Standard | 1.4269 | 1.4407 | 1.4484 | 1.4622 | 1.4699 | 1.4837 | 1.4914 |
| Camarilla | 1.4503 | 1.4523 | 1.4542 | 1.4562 | 1.4582 | 1.4601 | 1.4621 |
| Woodie | 1.4240 | 1.4392 | 1.4455 | 1.4607 | 1.4670 | 1.4822 | 1.4885 |
| Fibonacci | 1.4407 | 1.4489 | 1.4540 | 1.4622 | 1.4704 | 1.4755 | 1.4837 |
Numerical data
The following are the details of the technical indicators and moving averages that were collected to generate this technical analysis:
| RSI (14): | 35.46 | |
| MACD (12,26,9): | -0.0030 | |
| Directional Movement: | -16.1015 | |
| AROON (14): | -92.8571 | |
| DEMA (21): | 1.4555 | |
| Parabolic SAR (0,02-0,02-0,2): | 1.4639 | |
| Elder Ray (13): | -0.0084 | |
| Super Trend (3,10): | 1.4674 | |
| Zig ZAG (10): | 1.4471 | |
| VORTEX (21): | 0.8892 | |
| Stochastique (14,3,5): | 6.48 | |
| TEMA (21): | 1.4526 | |
| Williams %R (14): | -91.67 | |
| Chande Momentum Oscillator (20): | -0.0106 | |
| Repulse (5,40,3): | -0.8005 | |
| ROCnROLL: | 2 | |
| TRIX (15,9): | -0.0157 | |
| Courbe Coppock: | 1.39 |
| MA7: | 1.4557 | |
| MA20: | 1.4605 | |
| MA50: | 1.4621 | |
| MA100: | 1.4617 | |
| MAexp7: | 1.4542 | |
| MAexp20: | 1.4587 | |
| MAexp50: | 1.4612 | |
| MAexp100: | 1.4650 | |
| Price / MA7: | -0.61% | |
| Price / MA20: | -0.94% | |
| Price / MA50: | -1.05% | |
| Price / MA100: | -1.02% | |
| Price / MAexp7: | -0.51% | |
| Price / MAexp20: | -0.82% | |
| Price / MAexp50: | -0.99% | |
| Price / MAexp100: | -1.24% |
News
The latest news and videos published on EUR/CAD at the time of the analysis were as follows:
-
 Forex Analysis: EUR/USD, GBP/USD, EUR/CAD - Amana Capital
-
Why I'm looking to sell EURCAD: Coleman
-
EUR/CAD To Hold Steady
-
EUR/CAD Bullish Breakthrough
-
Bullish Divergence – EURCAD
About author

Online


Add a comment
Comments
0 comments on the analysis EUR/CAD - Daily