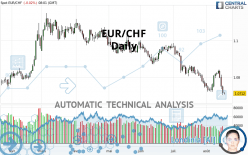
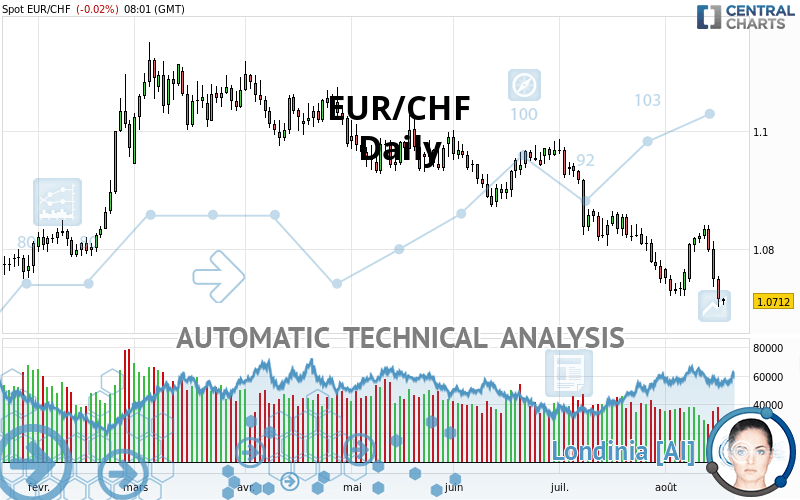
EUR/CHF - Daily - Technical analysis published on 08/18/2021 (GMT)
- 218
- 0
Click here for a new analysis!
- Timeframe : Daily
- - Analysis generated on
- Status : INVALID
Summary of the analysis

Additional analysis
Quotes
The EUR/CHF price is 1.0712 CHF. The price is lower by -0.02% since the last closing and was traded between 1.0704 CHF and 1.0717 CHF over the period. The price is currently at +0.07% from its lowest and -0.05% from its highest.The Central Gaps scanner detects a bullish opening marking the presence of buyers ahead of sellers at the opening but not sufficiently marked to allow the price to register a quotation gap.
Bullish opening
Type : Bullish
Timeframe : Openning
So that you have an overall view of the price change, here is a table showing the variations over several periods:
Near a new LOW record (5 years)
Type : Bearish
Timeframe : Weekly
Technical
A technical analysis in Daily of this EUR/CHF chart shows a sharp bearish trend. The signals given by moving averages are 92.86% bearish. This strong bearish trend is confirmed by the strong signals currently being given by short-term moving averages. The Central Indicators market scanner currently does not detect any result that concerns moving averages.
In fact, 13 technical indicators on 18 studied are currently bearish. Caution: the Central Indicators scanner currently detects an excess:
CCI indicator is oversold : under -100
Type : Neutral
Timeframe : Daily
Williams %R indicator is oversold : under -80
Type : Neutral
Timeframe : Daily
Pivot points : price is under support 1
Type : Neutral
Timeframe : Weekly
SuperTrend indicator bearish reversal
Type : Bearish
Timeframe : Daily
Price is back over the pivot point
Type : Bullish
Timeframe : Weekly
Price is back under the pivot point
Type : Bearish
Timeframe : Daily
Central Patterns, the market scanner focusing on chart patterns, resistances and supports found these results:
Horizontal support is broken
Type : Bearish
Timeframe : Daily
Support of channel is broken
Type : Bearish
Timeframe : Daily
The presence of a bearish pattern in Japanese candlesticks detected by Central Candlesticks that could cause a correction in the very short term was also detected:
Three black crows
Type : Bearish
Timeframe : Daily
| S3 | S2 | S1 | Price | R1 | R2 | R3 | |
|---|---|---|---|---|---|---|---|
| ProTrendLines | 0.9852 | 1.0514 | 1.0672 | 1.0712 | 1.0728 | 1.0761 | 1.0871 |
| Change (%) | -8.03% | -1.85% | -0.37% | - | +0.15% | +0.46% | +1.48% |
| Change | -0.0860 | -0.0198 | -0.0040 | - | +0.0016 | +0.0049 | +0.0159 |
| Level | Minor | Major | Minor | - | Major | Major | Major |
Attention could also be paid to pivot points to set price objectives:
| Pivot points | S3 | S2 | S1 | PP | R1 | R2 | R3 |
|---|---|---|---|---|---|---|---|
| Standard | 1.0640 | 1.0671 | 1.0692 | 1.0723 | 1.0744 | 1.0775 | 1.0796 |
| Camarilla | 1.0700 | 1.0705 | 1.0709 | 1.0714 | 1.0719 | 1.0724 | 1.0728 |
| Woodie | 1.0636 | 1.0669 | 1.0688 | 1.0721 | 1.0740 | 1.0773 | 1.0792 |
| Fibonacci | 1.0671 | 1.0691 | 1.0703 | 1.0723 | 1.0743 | 1.0755 | 1.0775 |
| Pivot points | S3 | S2 | S1 | PP | R1 | R2 | R3 |
|---|---|---|---|---|---|---|---|
| Standard | 1.0651 | 1.0697 | 1.0748 | 1.0794 | 1.0845 | 1.0891 | 1.0942 |
| Camarilla | 1.0771 | 1.0780 | 1.0789 | 1.0798 | 1.0807 | 1.0816 | 1.0825 |
| Woodie | 1.0653 | 1.0698 | 1.0750 | 1.0795 | 1.0847 | 1.0892 | 1.0944 |
| Fibonacci | 1.0697 | 1.0734 | 1.0757 | 1.0794 | 1.0831 | 1.0854 | 1.0891 |
| Pivot points | S3 | S2 | S1 | PP | R1 | R2 | R3 |
|---|---|---|---|---|---|---|---|
| Standard | 1.0419 | 1.0581 | 1.0664 | 1.0826 | 1.0909 | 1.1071 | 1.1154 |
| Camarilla | 1.0681 | 1.0703 | 1.0726 | 1.0748 | 1.0771 | 1.0793 | 1.0815 |
| Woodie | 1.0381 | 1.0561 | 1.0626 | 1.0806 | 1.0871 | 1.1051 | 1.1116 |
| Fibonacci | 1.0581 | 1.0674 | 1.0732 | 1.0826 | 1.0919 | 1.0977 | 1.1071 |
Numerical data
The following is the status of technical indicators and moving averages registered at the time this technical analysis was created:
| RSI (14): | 32.51 | |
| MACD (12,26,9): | -0.0029 | |
| Directional Movement: | -19.4305 | |
| AROON (14): | -14.2857 | |
| DEMA (21): | 1.0744 | |
| Parabolic SAR (0,02-0,02-0,2): | 1.0835 | |
| Elder Ray (13): | -0.0059 | |
| Super Trend (3,10): | 1.0821 | |
| Zig ZAG (10): | 1.0710 | |
| VORTEX (21): | 0.8393 | |
| Stochastique (14,3,5): | 12.48 | |
| TEMA (21): | 1.0743 | |
| Williams %R (14): | -95.00 | |
| Chande Momentum Oscillator (20): | -0.0041 | |
| Repulse (5,40,3): | -0.6257 | |
| ROCnROLL: | 2 | |
| TRIX (15,9): | -0.0381 | |
| Courbe Coppock: | 0.38 |
| MA7: | 1.0778 | |
| MA20: | 1.0775 | |
| MA50: | 1.0852 | |
| MA100: | 1.0922 | |
| MAexp7: | 1.0754 | |
| MAexp20: | 1.0783 | |
| MAexp50: | 1.0837 | |
| MAexp100: | 1.0877 | |
| Price / MA7: | -0.61% | |
| Price / MA20: | -0.58% | |
| Price / MA50: | -1.29% | |
| Price / MA100: | -1.92% | |
| Price / MAexp7: | -0.39% | |
| Price / MAexp20: | -0.66% | |
| Price / MAexp50: | -1.15% | |
| Price / MAexp100: | -1.52% |
News
Don't forget to follow the news on EUR/CHF. At the time of publication of this analysis, the latest news was as follows:
-
 Two potential approaches for shorting EUR/CHF
-
Bullish Sentiment Signals for EUR/JPY, EUR/CHF | Webinar
-
Will EUR/CHF target 1.0576? – 3rd July 2020
-
Weekly Technical Analysis: 09/03/2020 - USDJPY, GBPUSD, EURCHF
-
EURCHF on the Downslide
About author

Online


Add a comment
Comments
0 comments on the analysis EUR/CHF - Daily