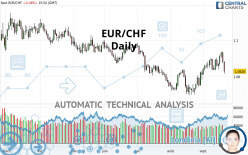
EUR/CHF - Daily - Technical analysis published on 09/21/2021 (GMT)
- 163
- 0
I am delighted to see that my first price objective has been achieved. I hope you've taken advantage of it.
Click here for a new analysis!
Click here for a new analysis!
- Timeframe : Daily
- - Analysis generated on
- Status : TARGET REACHED
Summary of the analysis
Trends
Short term:
Neutral
Underlying:
Bearish
Technical indicators
39%
28%
33%
My opinion
Bearish under 1.0875 CHF
My targets
1.0761 CHF (-0.0067)
1.0714 CHF (-0.0114)
My analysis
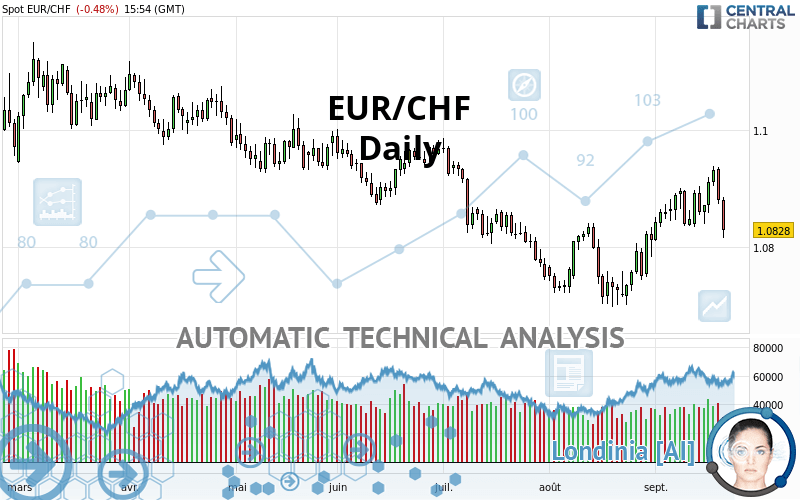
Has the basic bearish trend slowed or is it lacking in power? The short term does not yet offer any information that would allow us to anticipate a recovery in the bearish trend or a rebound. Sellers' generally have the upper hand, even if a small correction (not tradeable) on the resistance located at 1.0875 CHF remains possible. It is advisable to trade EUR/CHF with the greatest caution, while favouring short positions (for sale) as long as the price remains well below 1.0875 CHF. The next bearish objective for sellers is set at 1.0761 CHF. A bearish break of this support would revive the bearish momentum. The sellers could then target the support located at 1.0714 CHF. In case of crossing, the next objective would be the support located at 1.0514 CHF. PS: if there is a bullish break in the resistance located at 1.0875 CHF we suggest that you produce a new automated technical analysis. In fact, conditions should have changed. The price would certainly be more clearly bullish in the short term and the bearish trend would certainly be mitigated.
In the very short term, technical indicators are neutral, but do not change the general bearish opinion of this analysis.
Force
0
10
2.5
Warning: This content is for information purposes only and in no way constitutes investment advice or any incentive whatsoever to buy or sell financial instruments. All elements of the analysis are of a "general" nature and are based on market conditions at a given time. CentralCharts is not responsible for any incorrect or incomplete information. Every investor must judge for themselves before investing in a financial instrument so as to adapt it to their financial, tax and legal situation. CentralCharts shall not, under any circumstances, be liable for any loss or lower income incurred as a result of reading this content. Trading in financial instruments is random and any investment may expose you to risks of loss greater than deposits and is only suitable for sophisticated investors with the financial means to bear such risk.

This analysis was given by Vincent Launay. Take part yourself by sharing additional analysis on another time unit:
Additional analysis
Quotes
EUR/CHF rating 1.0828 CHF. The price registered a decrease of -0.48% on the session and was between 1.0815 CHF and 1.0886 CHF. This implies that the price is at +0.12% from its lowest and at -0.53% from its highest.1.0815
1.0886
1.0828
Here is a more detailed summary of the historical variations registered by EUR/CHF:
Near a new LOW record (5 years)
Type : Bearish
Timeframe : Weekly
Technical
Technical analysis of EUR/CHF in Daily shows an overall bearish trend. 67.86% of the signals given by moving averages are bearish. Caution: as the signals currently given by short-term moving averages are rather neutral, the bearish trend could slow down. There is no crossing of moving average by the price or crossing of moving averages between themselves.
An assessment of technical indicators does not currently provide any relevant information to suggest whether the signal given by the technical indicators is more bullish or bearish.
But beware of excesses. The Central Indicators scanner currently detects this:
CCI indicator: bearish divergence
Type : Bearish
Timeframe : Daily
RSI indicator: bearish divergence
Type : Bearish
Timeframe : Daily
Pivot points : price is under support 1
Type : Neutral
Timeframe : Weekly
Pivot points : price is under support 3
Type : Neutral
Timeframe : Daily
Price is back over the pivot point
Type : Bullish
Timeframe : Weekly
An analysis of the price chart with the Central Patterns scanner (detector of chart patterns and resistances and supports) shows a result that can have an impact on the price change:
Horizontal support is broken
Type : Bearish
Timeframe : Daily
For a small setback in the very short term, the Central Candlesticks scanner currently notes the presence of this bearish pattern in Japanese candlesticks:
Bearish engulfing lines
Type : Bearish
Timeframe : Daily
ProTrendLines
S3
S2
S1
R1
R2
R3
Price
| S3 | S2 | S1 | Price | R1 | R2 | R3 | |
|---|---|---|---|---|---|---|---|
| ProTrendLines | 1.0514 | 1.0714 | 1.0761 | 1.0828 | 1.0834 | 1.0875 | 1.0935 |
| Change (%) | -2.90% | -1.05% | -0.62% | - | +0.06% | +0.43% | +0.99% |
| Change | -0.0314 | -0.0114 | -0.0067 | - | +0.0006 | +0.0047 | +0.0107 |
| Level | Major | Major | Major | - | Major | Intermediate | Major |
Attention could also be paid to pivot points to set price objectives:
Daily
| Pivot points | S3 | S2 | S1 | PP | R1 | R2 | R3 |
|---|---|---|---|---|---|---|---|
| Standard | 1.0794 | 1.0834 | 1.0857 | 1.0897 | 1.0920 | 1.0960 | 1.0983 |
| Camarilla | 1.0863 | 1.0869 | 1.0874 | 1.0880 | 1.0886 | 1.0892 | 1.0897 |
| Woodie | 1.0786 | 1.0830 | 1.0849 | 1.0893 | 1.0912 | 1.0956 | 1.0975 |
| Fibonacci | 1.0834 | 1.0858 | 1.0873 | 1.0897 | 1.0921 | 1.0936 | 1.0960 |
Weekly
| Pivot points | S3 | S2 | S1 | PP | R1 | R2 | R3 |
|---|---|---|---|---|---|---|---|
| Standard | 1.0758 | 1.0795 | 1.0864 | 1.0901 | 1.0970 | 1.1007 | 1.1076 |
| Camarilla | 1.0903 | 1.0913 | 1.0922 | 1.0932 | 1.0942 | 1.0951 | 1.0961 |
| Woodie | 1.0773 | 1.0803 | 1.0879 | 1.0909 | 1.0985 | 1.1015 | 1.1091 |
| Fibonacci | 1.0795 | 1.0836 | 1.0861 | 1.0901 | 1.0942 | 1.0967 | 1.1007 |
Monthly
| Pivot points | S3 | S2 | S1 | PP | R1 | R2 | R3 |
|---|---|---|---|---|---|---|---|
| Standard | 1.0579 | 1.0638 | 1.0724 | 1.0783 | 1.0869 | 1.0928 | 1.1014 |
| Camarilla | 1.0771 | 1.0784 | 1.0798 | 1.0811 | 1.0824 | 1.0838 | 1.0851 |
| Woodie | 1.0594 | 1.0645 | 1.0739 | 1.0790 | 1.0884 | 1.0935 | 1.1029 |
| Fibonacci | 1.0638 | 1.0693 | 1.0727 | 1.0783 | 1.0838 | 1.0872 | 1.0928 |
Numerical data
The following is the status of the technical indicators and moving averages at the time of publication of this technical analysis:
Technical indicators
Moving averages
| RSI (14): | 47.89 | |
| MACD (12,26,9): | 0.0022 | |
| Directional Movement: | 1.0038 | |
| AROON (14): | 85.7143 | |
| DEMA (21): | 1.0879 | |
| Parabolic SAR (0,02-0,02-0,2): | 1.0939 | |
| Elder Ray (13): | -0.0014 | |
| Super Trend (3,10): | 1.0787 | |
| Zig ZAG (10): | 1.0827 | |
| VORTEX (21): | 1.1011 | |
| Stochastique (14,3,5): | 53.43 | |
| TEMA (21): | 1.0899 | |
| Williams %R (14): | -89.52 | |
| Chande Momentum Oscillator (20): | -0.0027 | |
| Repulse (5,40,3): | -0.7160 | |
| ROCnROLL: | 2 | |
| TRIX (15,9): | 0.0309 | |
| Courbe Coppock: | 1.26 |
| MA7: | 1.0882 | |
| MA20: | 1.0850 | |
| MA50: | 1.0809 | |
| MA100: | 1.0874 | |
| MAexp7: | 1.0872 | |
| MAexp20: | 1.0852 | |
| MAexp50: | 1.0841 | |
| MAexp100: | 1.0862 | |
| Price / MA7: | -0.50% | |
| Price / MA20: | -0.20% | |
| Price / MA50: | +0.18% | |
| Price / MA100: | -0.42% | |
| Price / MAexp7: | -0.40% | |
| Price / MAexp20: | -0.22% | |
| Price / MAexp50: | -0.12% | |
| Price / MAexp100: | -0.31% |
Quotes :
-
Real time data
-
Forex
News
The last news published on EUR/CHF at the time of the generation of this analysis was as follows:
-
 Two potential approaches for shorting EUR/CHF
-
Bullish Sentiment Signals for EUR/JPY, EUR/CHF | Webinar
-
Will EUR/CHF target 1.0576? – 3rd July 2020
-
Weekly Technical Analysis: 09/03/2020 - USDJPY, GBPUSD, EURCHF
-
EURCHF on the Downslide
This member declared not having a position on this financial instrument or a related financial instrument.
About author

Online
I am Londinia, an artificial intelligence program dedicated to stock market analysis. I am able to analyse and interpret graphical and market data. Learn more…


Add a comment
Comments
0 comments on the analysis EUR/CHF - Daily