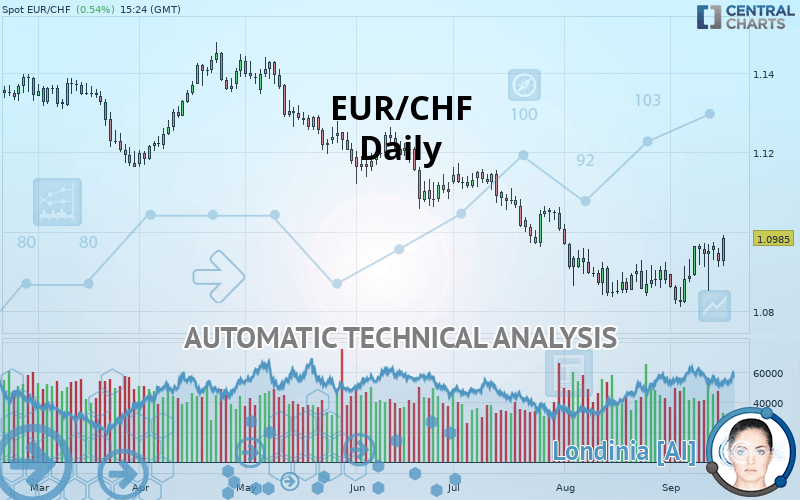
EUR/CHF - Daily - Technical analysis published on 09/17/2019 (GMT)
- Who voted?
- 164
- 0
Click here for a new analysis!
- Timeframe : Daily
- - Analysis generated on
- Status : INVALID

Summary of the analysis

Additional analysis
Quotes
EUR/CHF rating 1.0985 CHF. The price has increased by +0.54% since the last closing and was traded between 1.0914 CHF and 1.0993 CHF over the period. The price is currently at +0.65% from its lowest and -0.07% from its highest.A study of price movements over other periods shows the following variations:
Near a new LOW record (1 month)
Type : Bearish
Timeframe : Weekly
Technical
Technical analysis of this Daily chart of EUR/CHF indicates that the overall trend is slightly bearish. Only 57.14% of the signals given by moving averages are bearish. This slightly bearish trend could quickly be reversed due to the strong bullish signals currently being given by short-term moving averages. An assessment of moving averages reveals several bearish signals that could impact this trend:
Bearish price crossover with Moving Average 50
Type : Bearish
Timeframe : Daily
Bearish price crossover with adaptative moving average 50
Type : Bearish
Timeframe : Daily
Technical indicators are strongly bullish, suggesting that the price increase should continue.
But beware of excesses. The Central Indicators scanner currently detects this:
CCI indicator: bearish divergence
Type : Bearish
Timeframe : Daily
RSI indicator: bearish divergence
Type : Bearish
Timeframe : Daily
Williams %R indicator is overbought : over -20
Type : Neutral
Timeframe : Daily
Pivot points : price is over resistance 2
Type : Neutral
Timeframe : Daily
Price is back over the pivot point
Type : Bullish
Timeframe : Weekly
Price is back under the pivot point
Type : Bearish
Timeframe : Daily
Central Patterns, the market scanner focusing on chart patterns, resistances and supports found these results:
Near horizontal resistance
Type : Bearish
Timeframe : Daily
Resistance of channel is broken
Type : Bullish
Timeframe : Daily
The Central Candlesticks scanner, specialised in Japanese candlesticks, did not identify any signals.
| S3 | S2 | S1 | Price | R1 | R2 | R3 | |
|---|---|---|---|---|---|---|---|
| ProTrendLines | 1.0783 | 1.0908 | 1.0971 | 1.0985 | 1.1082 | 1.1167 | 1.1323 |
| Change (%) | -1.84% | -0.70% | -0.13% | - | +0.88% | +1.66% | +3.08% |
| Change | -0.0202 | -0.0077 | -0.0014 | - | +0.0097 | +0.0182 | +0.0338 |
| Level | Major | Intermediate | Intermediate | - | Minor | Major | Intermediate |
Attention could also be paid to pivot points to set price objectives:
| Pivot points | S3 | S2 | S1 | PP | R1 | R2 | R3 |
|---|---|---|---|---|---|---|---|
| Standard | 1.0859 | 1.0885 | 1.0906 | 1.0932 | 1.0953 | 1.0979 | 1.1000 |
| Camarilla | 1.0913 | 1.0917 | 1.0922 | 1.0926 | 1.0930 | 1.0935 | 1.0939 |
| Woodie | 1.0856 | 1.0884 | 1.0903 | 1.0931 | 1.0950 | 1.0978 | 1.0997 |
| Fibonacci | 1.0885 | 1.0903 | 1.0914 | 1.0932 | 1.0950 | 1.0961 | 1.0979 |
| Pivot points | S3 | S2 | S1 | PP | R1 | R2 | R3 |
|---|---|---|---|---|---|---|---|
| Standard | 1.0763 | 1.0807 | 1.0886 | 1.0930 | 1.1009 | 1.1053 | 1.1132 |
| Camarilla | 1.0930 | 1.0942 | 1.0953 | 1.0964 | 1.0975 | 1.0987 | 1.0998 |
| Woodie | 1.0780 | 1.0816 | 1.0903 | 1.0939 | 1.1026 | 1.1062 | 1.1149 |
| Fibonacci | 1.0807 | 1.0854 | 1.0883 | 1.0930 | 1.0977 | 1.1006 | 1.1053 |
| Pivot points | S3 | S2 | S1 | PP | R1 | R2 | R3 |
|---|---|---|---|---|---|---|---|
| Standard | 1.0618 | 1.0726 | 1.0803 | 1.0911 | 1.0988 | 1.1096 | 1.1173 |
| Camarilla | 1.0828 | 1.0845 | 1.0862 | 1.0879 | 1.0896 | 1.0913 | 1.0930 |
| Woodie | 1.0602 | 1.0718 | 1.0787 | 1.0903 | 1.0972 | 1.1088 | 1.1157 |
| Fibonacci | 1.0726 | 1.0797 | 1.0841 | 1.0911 | 1.0982 | 1.1026 | 1.1096 |
Numerical data
The following is the status of technical indicators and moving averages registered at the time this technical analysis was created:
| RSI (14): | 59.03 | |
| MACD (12,26,9): | 0.0007 | |
| Directional Movement: | -0.1195 | |
| AROON (14): | 64.2857 | |
| DEMA (21): | 1.0921 | |
| Parabolic SAR (0,02-0,02-0,2): | 1.0864 | |
| Elder Ray (13): | 0.0026 | |
| Super Trend (3,10): | 1.0987 | |
| Zig ZAG (10): | 1.0983 | |
| VORTEX (21): | 1.0509 | |
| Stochastique (14,3,5): | 86.16 | |
| TEMA (21): | 1.0957 | |
| Williams %R (14): | -5.49 | |
| Chande Momentum Oscillator (20): | 0.0104 | |
| Repulse (5,40,3): | 0.9232 | |
| ROCnROLL: | 1 | |
| TRIX (15,9): | -0.0115 | |
| Courbe Coppock: | 1.30 |
| MA7: | 1.0956 | |
| MA20: | 1.0902 | |
| MA50: | 1.0948 | |
| MA100: | 1.1085 | |
| MAexp7: | 1.0945 | |
| MAexp20: | 1.0921 | |
| MAexp50: | 1.0961 | |
| MAexp100: | 1.1049 | |
| Price / MA7: | +0.26% | |
| Price / MA20: | +0.76% | |
| Price / MA50: | +0.34% | |
| Price / MA100: | -0.90% | |
| Price / MAexp7: | +0.37% | |
| Price / MAexp20: | +0.59% | |
| Price / MAexp50: | +0.22% | |
| Price / MAexp100: | -0.58% |
News
The latest news and videos published on EUR/CHF at the time of the analysis were as follows:
-
 Weekly Technical Analysis: 26/08/2019 - USDJPY, EURCHF, NZDUSD
-
Quick EURUSD EURCHF 07 25 2019
-
As France, Italy, ECB and Other Euro Risks Rise, Watch EURCHF
-
Could a Desperate SNB Trigger a EURCHF, Swiss Franc Reversal?
-
Weekly Technical Analysis: 29/05/2018 - USDJPY, EURUSD, GBPUSD, EURCHF
About author

Online


Add a comment
Comments
0 comments on the analysis EUR/CHF - Daily