EUR/CHF - Daily - Technical analysis published on 12/04/2019 (GMT)
- Who voted?
- 198
- 0
Click here for a new analysis!
- Timeframe : Daily
- - Analysis generated on
- Status : TARGET REACHED
Summary of the analysis

Additional analysis
Quotes
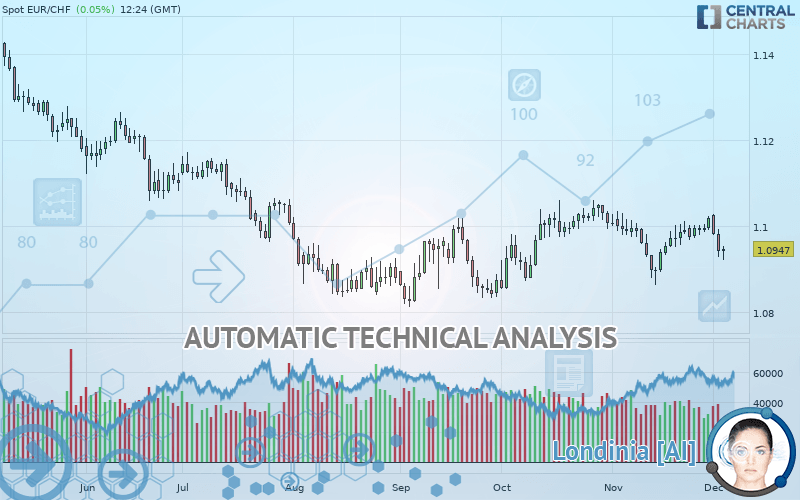
EUR/CHF rating 1.0947 CHF. On the day, this instrument gained +0.05% and was traded between 1.0921 CHF and 1.0954 CHF over the period. The price is currently at +0.24% from its lowest and -0.06% from its highest.The Central Gaps scanner detects a bearish opening. A small advantage for sellers in the very short term.
Bearish opening
Type : Bearish
Timeframe : Openning
So that you have an overall view of the price change, here is a table showing the variations over several periods:
Technical
Technical analysis of EUR/CHF in Daily shows an overall bearish trend. 71.43% of the signals given by moving averages are bearish. This bearish trend is supported by the strong bearish signals given by short-term moving averages. The Central Indicators market scanner is currently detecting several bearish signals that could impact this trend:
Bearish trend reversal : adaptative moving average 20
Type : Bearish
Timeframe : Daily
Bearish trend reversal : adaptative moving average 50
Type : Bearish
Timeframe : Daily
Bearish price crossover with Moving Average 20
Type : Bearish
Timeframe : Daily
Bearish price crossover with Moving Average 50
Type : Bearish
Timeframe : Daily
Bearish price crossover with Moving Average 100
Type : Bearish
Timeframe : Daily
Bearish price crossover with adaptative moving average 20
Type : Bearish
Timeframe : Daily
Bearish price crossover with adaptative moving average 50
Type : Bearish
Timeframe : Daily
Bearish price crossover with adaptative moving average 100
Type : Bearish
Timeframe : Daily
An assessment of technical indicators does not currently provide any relevant information on the direction of future price movements.
Central Indicators, the scanner specialised in technical indicators, has identified these signals:
Pivot points : price is under support 1
Type : Neutral
Timeframe : Weekly
RSI indicator is back under 50
Type : Bearish
Timeframe : Daily
MACD crosses DOWN its Moving Average
Type : Bearish
Timeframe : Daily
Parabolic SAR indicator bearish reversal
Type : Bearish
Timeframe : Daily
Price is back over the pivot point
Type : Bullish
Timeframe : Weekly
Price is back under the pivot point
Type : Bearish
Timeframe : Daily
Williams %R indicator is back under -50
Type : Bearish
Timeframe : Daily
No signals are given by Central Patterns, a market scanner specialised in chart patterns, resistances and supports.
The Central Candlesticks scanner which studies Japanese candlesticks did not detect anything.
| S3 | S2 | S1 | Price | R1 | R2 | R3 | |
|---|---|---|---|---|---|---|---|
| ProTrendLines | 1.0639 | 1.0828 | 1.0897 | 1.0947 | 1.0971 | 1.1049 | 1.1167 |
| Change (%) | -2.81% | -1.09% | -0.46% | - | +0.22% | +0.93% | +2.01% |
| Change | -0.0308 | -0.0119 | -0.0050 | - | +0.0024 | +0.0102 | +0.0220 |
| Level | Major | Major | Intermediate | - | Intermediate | Intermediate | Major |
Pivot points can also be used to set your price objectives. Here is the price situation in relation to pivot points:
| Pivot points | S3 | S2 | S1 | PP | R1 | R2 | R3 |
|---|---|---|---|---|---|---|---|
| Standard | 1.0849 | 1.0888 | 1.0915 | 1.0954 | 1.0981 | 1.1020 | 1.1047 |
| Camarilla | 1.0924 | 1.0930 | 1.0936 | 1.0942 | 1.0948 | 1.0954 | 1.0960 |
| Woodie | 1.0843 | 1.0885 | 1.0909 | 1.0951 | 1.0975 | 1.1017 | 1.1041 |
| Fibonacci | 1.0888 | 1.0913 | 1.0929 | 1.0954 | 1.0979 | 1.0995 | 1.1020 |
| Pivot points | S3 | S2 | S1 | PP | R1 | R2 | R3 |
|---|---|---|---|---|---|---|---|
| Standard | 1.0927 | 1.0947 | 1.0983 | 1.1003 | 1.1039 | 1.1059 | 1.1095 |
| Camarilla | 1.1004 | 1.1009 | 1.1014 | 1.1019 | 1.1024 | 1.1029 | 1.1034 |
| Woodie | 1.0935 | 1.0951 | 1.0991 | 1.1007 | 1.1047 | 1.1063 | 1.1103 |
| Fibonacci | 1.0947 | 1.0968 | 1.0982 | 1.1003 | 1.1024 | 1.1038 | 1.1059 |
| Pivot points | S3 | S2 | S1 | PP | R1 | R2 | R3 |
|---|---|---|---|---|---|---|---|
| Standard | 1.0738 | 1.0800 | 1.0910 | 1.0972 | 1.1082 | 1.1144 | 1.1254 |
| Camarilla | 1.0972 | 1.0988 | 1.1003 | 1.1019 | 1.1035 | 1.1051 | 1.1066 |
| Woodie | 1.0761 | 1.0812 | 1.0933 | 1.0984 | 1.1105 | 1.1156 | 1.1277 |
| Fibonacci | 1.0800 | 1.0866 | 1.0907 | 1.0972 | 1.1038 | 1.1079 | 1.1144 |
Numerical data
The following are the details of the technical indicators and moving averages that were collected to generate this technical analysis:
| RSI (14): | 44.36 | |
| MACD (12,26,9): | -0.0001 | |
| Directional Movement: | -6.7709 | |
| AROON (14): | 85.7143 | |
| DEMA (21): | 1.0974 | |
| Parabolic SAR (0,02-0,02-0,2): | 1.1028 | |
| Elder Ray (13): | -0.0036 | |
| Super Trend (3,10): | 1.0898 | |
| Zig ZAG (10): | 1.0948 | |
| VORTEX (21): | 0.9302 | |
| Stochastique (14,3,5): | 53.38 | |
| TEMA (21): | 1.0969 | |
| Williams %R (14): | -59.26 | |
| Chande Momentum Oscillator (20): | -0.0005 | |
| Repulse (5,40,3): | -0.2798 | |
| ROCnROLL: | 2 | |
| TRIX (15,9): | 0.0008 | |
| Courbe Coppock: | 0.58 |
| MA7: | 1.0981 | |
| MA20: | 1.0966 | |
| MA50: | 1.0969 | |
| MA100: | 1.0947 | |
| MAexp7: | 1.0970 | |
| MAexp20: | 1.0974 | |
| MAexp50: | 1.0971 | |
| MAexp100: | 1.0994 | |
| Price / MA7: | -0.31% | |
| Price / MA20: | -0.17% | |
| Price / MA50: | -0.20% | |
| Price / MA100: | -0% | |
| Price / MAexp7: | -0.21% | |
| Price / MAexp20: | -0.25% | |
| Price / MAexp50: | -0.22% | |
| Price / MAexp100: | -0.43% |
News
Don"t forget to follow the news on EUR/CHF. At the time of publication of this analysis, the latest news was as follows:
-
 Weekly Technical Analysis: 26/08/2019 - USDJPY, EURCHF, NZDUSD
-
Quick EURUSD EURCHF 07 25 2019
-
As France, Italy, ECB and Other Euro Risks Rise, Watch EURCHF
-
Could a Desperate SNB Trigger a EURCHF, Swiss Franc Reversal?
-
Weekly Technical Analysis: 29/05/2018 - USDJPY, EURUSD, GBPUSD, EURCHF
About author

Online


Add a comment
Comments
0 comments on the analysis EUR/CHF - Daily