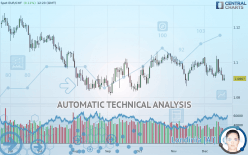
EUR/CHF - Daily - Technical analysis published on 12/19/2019 (GMT)
- Who voted?
- 167
- 0
Click here for a new analysis!
- Timeframe : Daily
- - Analysis generated on
- Status : TARGET REACHED

Summary of the analysis

Additional analysis
Quotes
The EUR/CHF price is 1.0907 CHF. On the day, this instrument gained +0.11% with the lowest point at 1.0894 CHF and the highest point at 1.0927 CHF. The deviation from the price is +0.12% for the low point and -0.18% for the high point.Here is a more detailed summary of the historical variations registered by EUR/CHF:
Near a new LOW record (1st january)
Type : Bearish
Timeframe : Weekly
Near a new HIGH record (1 month)
Type : Bullish
Timeframe : Weekly
Technical
A technical analysis in Daily of this EUR/CHF chart shows a sharp bearish trend. 85.71% of the signals given by moving averages are bearish. The overall trend is supported by the strong bearish signals from short-term moving averages. The Central Indicators market scanner is currently detecting a bearish signal that could impact this trend:
Bearish trend reversal : Moving Average 50
Type : Bearish
Timeframe : Daily
The probability of a further decline is high given the direction of the technical indicators.
Caution: the Central Indicators scanner currently detects an excess:
CCI indicator is oversold : under -100
Type : Neutral
Timeframe : Daily
Williams %R indicator is oversold : under -80
Type : Neutral
Timeframe : Daily
Parabolic SAR indicator bearish reversal
Type : Bearish
Timeframe : Daily
SuperTrend indicator bearish reversal
Type : Bearish
Timeframe : Daily
Price is back under the pivot point
Type : Bearish
Timeframe : Daily
The Central Patterns scanner, which studies chart patterns, resistances and supports, has identified these signals:
Near horizontal support
Type : Bullish
Timeframe : Daily
Near support of triangle
Type : Bullish
Timeframe : Daily
Support of channel is broken
Type : Bearish
Timeframe : Daily
No result was found by the Central Candlesticks scanner on Japanese candlesticks.
| S3 | S2 | S1 | Price | R1 | R2 | R3 | |
|---|---|---|---|---|---|---|---|
| ProTrendLines | 1.0639 | 1.0828 | 1.0897 | 1.0907 | 1.0971 | 1.1018 | 1.1167 |
| Change (%) | -2.46% | -0.72% | -0.09% | - | +0.59% | +1.02% | +2.38% |
| Change | -0.0268 | -0.0079 | -0.0010 | - | +0.0064 | +0.0111 | +0.0260 |
| Level | Major | Major | Intermediate | - | Intermediate | Major | Major |
Attention could also be paid to pivot points to set price objectives:
| Pivot points | S3 | S2 | S1 | PP | R1 | R2 | R3 |
|---|---|---|---|---|---|---|---|
| Standard | 1.0847 | 1.0870 | 1.0883 | 1.0906 | 1.0919 | 1.0942 | 1.0955 |
| Camarilla | 1.0885 | 1.0888 | 1.0892 | 1.0895 | 1.0898 | 1.0902 | 1.0905 |
| Woodie | 1.0841 | 1.0868 | 1.0877 | 1.0904 | 1.0913 | 1.0940 | 1.0949 |
| Fibonacci | 1.0870 | 1.0884 | 1.0893 | 1.0906 | 1.0920 | 1.0929 | 1.0942 |
| Pivot points | S3 | S2 | S1 | PP | R1 | R2 | R3 |
|---|---|---|---|---|---|---|---|
| Standard | 1.0763 | 1.0836 | 1.0889 | 1.0962 | 1.1015 | 1.1088 | 1.1141 |
| Camarilla | 1.0906 | 1.0918 | 1.0930 | 1.0941 | 1.0953 | 1.0964 | 1.0976 |
| Woodie | 1.0752 | 1.0831 | 1.0878 | 1.0957 | 1.1004 | 1.1083 | 1.1130 |
| Fibonacci | 1.0836 | 1.0885 | 1.0914 | 1.0962 | 1.1011 | 1.1040 | 1.1088 |
| Pivot points | S3 | S2 | S1 | PP | R1 | R2 | R3 |
|---|---|---|---|---|---|---|---|
| Standard | 1.0738 | 1.0800 | 1.0910 | 1.0972 | 1.1082 | 1.1144 | 1.1254 |
| Camarilla | 1.0972 | 1.0988 | 1.1003 | 1.1019 | 1.1035 | 1.1051 | 1.1066 |
| Woodie | 1.0761 | 1.0812 | 1.0933 | 1.0984 | 1.1105 | 1.1156 | 1.1277 |
| Fibonacci | 1.0800 | 1.0866 | 1.0907 | 1.0972 | 1.1038 | 1.1079 | 1.1144 |
Numerical data
The following is the status of the technical indicators and moving averages at the time of publication of this technical analysis:
| RSI (14): | 42.37 | |
| MACD (12,26,9): | -0.0014 | |
| Directional Movement: | -0.1881 | |
| AROON (14): | -35.7143 | |
| DEMA (21): | 1.0933 | |
| Parabolic SAR (0,02-0,02-0,2): | 1.1033 | |
| Elder Ray (13): | -0.0030 | |
| Super Trend (3,10): | 1.1046 | |
| Zig ZAG (10): | 1.0906 | |
| VORTEX (21): | 0.9368 | |
| Stochastique (14,3,5): | 7.58 | |
| TEMA (21): | 1.0920 | |
| Williams %R (14): | -91.55 | |
| Chande Momentum Oscillator (20): | -0.0036 | |
| Repulse (5,40,3): | -0.5148 | |
| ROCnROLL: | 2 | |
| TRIX (15,9): | -0.0105 | |
| Courbe Coppock: | 0.96 |
| MA7: | 1.0940 | |
| MA20: | 1.0959 | |
| MA50: | 1.0978 | |
| MA100: | 1.0938 | |
| MAexp7: | 1.0928 | |
| MAexp20: | 1.0949 | |
| MAexp50: | 1.0960 | |
| MAexp100: | 1.0984 | |
| Price / MA7: | -0.30% | |
| Price / MA20: | -0.47% | |
| Price / MA50: | -0.65% | |
| Price / MA100: | -0.28% | |
| Price / MAexp7: | -0.19% | |
| Price / MAexp20: | -0.38% | |
| Price / MAexp50: | -0.48% | |
| Price / MAexp100: | -0.70% |
News
Don"t forget to follow the news on EUR/CHF. At the time of publication of this analysis, the latest news was as follows:
-
 Weekly Technical Analysis: 26/08/2019 - USDJPY, EURCHF, NZDUSD
-
Quick EURUSD EURCHF 07 25 2019
-
As France, Italy, ECB and Other Euro Risks Rise, Watch EURCHF
-
Could a Desperate SNB Trigger a EURCHF, Swiss Franc Reversal?
-
Weekly Technical Analysis: 29/05/2018 - USDJPY, EURUSD, GBPUSD, EURCHF
About author

Online


Add a comment
Comments
0 comments on the analysis EUR/CHF - Daily