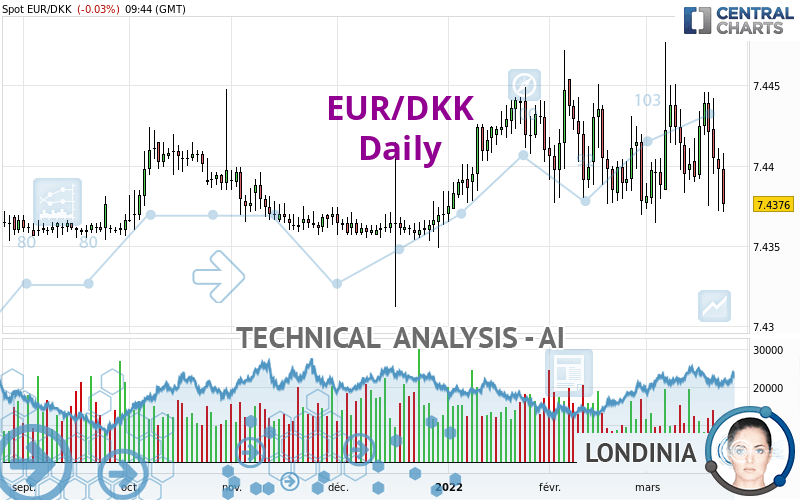
EUR/DKK - Daily - Technical analysis published on 03/23/2022 (GMT)
- 227
- 0
Click here for a new analysis!
- Timeframe : Daily
- - Analysis generated on
- Status : INVALID

Summary of the analysis

Additional analysis
Quotes
The EUR/DKK rating is 7.4376 DKK. The price is lower by -0.03% since the last closing and was traded between 7.4371 DKK and 7.4408 DKK over the period. The price is currently at +0.01% from its lowest and -0.04% from its highest.A study of price movements over other periods shows the following variations:
Near a new HIGH record (5 years)
Type : Bullish
Timeframe : Weekly
Near a new HIGH record (1 year)
Type : Bullish
Timeframe : Weekly
Near a new HIGH record (1st january)
Type : Bullish
Timeframe : Weekly
Near a new HIGH record (1 month)
Type : Bullish
Timeframe : Weekly
Technical
Technical analysis of this Daily chart of EUR/DKK indicates that the overall trend is bearish. The signals given by moving averages are 75.00% bearish. This bearish trend is reinforced by the strong signals currently being given by short-term moving averages. An assessment of moving averages reveals several bearish signals that could impact this trend:
Bearish trend reversal : Moving Average 50
Type : Bearish
Timeframe : Daily
Bearish price crossover with Moving Average 100
Type : Bearish
Timeframe : Daily
Bearish price crossover with adaptative moving average 100
Type : Bearish
Timeframe : Daily
An assessment of technical indicators does not currently provide any relevant information to suggest whether the signal given by the technical indicators is more bullish or bearish.
But beware of excesses. The Central Indicators scanner currently detects this:
CCI indicator is oversold : under -100
Type : Neutral
Timeframe : Daily
Williams %R indicator is oversold : under -80
Type : Neutral
Timeframe : Daily
Pivot points : price is under support 1
Type : Neutral
Timeframe : Weekly
Ichimoku : price is under the cloud
Type : Bearish
Timeframe : Daily
SuperTrend indicator bearish reversal
Type : Bearish
Timeframe : Daily
MACD indicator is back under 0
Type : Bearish
Timeframe : Daily
Price is back under the pivot point
Type : Bearish
Timeframe : Daily
Momentum indicator is back under 0
Type : Bearish
Timeframe : Daily
Central Patterns, the market scanner focusing on chart patterns, resistances and supports found these results:
Horizontal support is broken
Type : Bearish
Timeframe : Daily
Support of channel is broken
Type : Bearish
Timeframe : Daily
The Central Candlesticks scanner, specialised in Japanese candlesticks, did not identify any signals.
| S3 | S2 | S1 | Price | R1 | R2 | R3 | |
|---|---|---|---|---|---|---|---|
| ProTrendLines | 7.4329 | 7.4358 | 7.4370 | 7.4376 | 7.4385 | 7.4396 | 7.4411 |
| Change (%) | -0.06% | -0.02% | -0.01% | - | +0.01% | +0.03% | +0.05% |
| Change | -0.0047 | -0.0018 | -0.0006 | - | +0.0009 | +0.0020 | +0.0035 |
| Level | Major | Major | Intermediate | - | Major | Major | Major |
Attention could also be paid to pivot points to set price objectives:
| Pivot points | S3 | S2 | S1 | PP | R1 | R2 | R3 |
|---|---|---|---|---|---|---|---|
| Standard | 7.4337 | 7.4355 | 7.4376 | 7.4394 | 7.4415 | 7.4433 | 7.4454 |
| Camarilla | 7.4387 | 7.4391 | 7.4394 | 7.4398 | 7.4402 | 7.4405 | 7.4409 |
| Woodie | 7.4340 | 7.4356 | 7.4379 | 7.4395 | 7.4418 | 7.4434 | 7.4457 |
| Fibonacci | 7.4355 | 7.4370 | 7.4379 | 7.4394 | 7.4409 | 7.4418 | 7.4433 |
| Pivot points | S3 | S2 | S1 | PP | R1 | R2 | R3 |
|---|---|---|---|---|---|---|---|
| Standard | 7.4311 | 7.4343 | 7.4382 | 7.4414 | 7.4453 | 7.4485 | 7.4524 |
| Camarilla | 7.4402 | 7.4408 | 7.4415 | 7.4421 | 7.4428 | 7.4434 | 7.4441 |
| Woodie | 7.4315 | 7.4345 | 7.4386 | 7.4416 | 7.4457 | 7.4487 | 7.4528 |
| Fibonacci | 7.4343 | 7.4370 | 7.4387 | 7.4414 | 7.4441 | 7.4458 | 7.4485 |
| Pivot points | S3 | S2 | S1 | PP | R1 | R2 | R3 |
|---|---|---|---|---|---|---|---|
| Standard | 7.4238 | 7.4303 | 7.4341 | 7.4406 | 7.4444 | 7.4509 | 7.4547 |
| Camarilla | 7.4350 | 7.4359 | 7.4369 | 7.4378 | 7.4387 | 7.4397 | 7.4406 |
| Woodie | 7.4224 | 7.4296 | 7.4327 | 7.4399 | 7.4430 | 7.4502 | 7.4533 |
| Fibonacci | 7.4303 | 7.4343 | 7.4367 | 7.4406 | 7.4446 | 7.4470 | 7.4509 |
Numerical data
The following are the details of the technical indicators and moving averages that were collected to generate this technical analysis:
| RSI (14): | 41.39 | |
| MACD (12,26,9): | -0.0002 | |
| Directional Movement: | -4.2384 | |
| AROON (14): | 14.2857 | |
| DEMA (21): | 7.4404 | |
| Parabolic SAR (0,02-0,02-0,2): | 7.4469 | |
| Elder Ray (13): | -0.0016 | |
| Super Trend (3,10): | 7.4506 | |
| Zig ZAG (10): | 7.4373 | |
| VORTEX (21): | 0.9900 | |
| Stochastique (14,3,5): | 22.75 | |
| TEMA (21): | 7.4402 | |
| Williams %R (14): | -98.11 | |
| Chande Momentum Oscillator (20): | -0.0049 | |
| Repulse (5,40,3): | -0.0573 | |
| ROCnROLL: | 2 | |
| TRIX (15,9): | 0.0001 | |
| Courbe Coppock: | 0.01 |
| MA7: | 7.4408 | |
| MA20: | 7.4406 | |
| MA50: | 7.4413 | |
| MA100: | 7.4391 | |
| MAexp7: | 7.4402 | |
| MAexp20: | 7.4406 | |
| MAexp50: | 7.4404 | |
| MAexp100: | 7.4397 | |
| Price / MA7: | -0.04% | |
| Price / MA20: | -0.04% | |
| Price / MA50: | -0.05% | |
| Price / MA100: | -0.02% | |
| Price / MAexp7: | -0.03% | |
| Price / MAexp20: | -0.04% | |
| Price / MAexp50: | -0.04% | |
| Price / MAexp100: | -0.03% |
About author

Online


Add a comment
Comments
0 comments on the analysis EUR/DKK - Daily