CONSTELLATION PHARMACEUTICALS - Daily - Technical analysis published on 09/19/2019 (GMT)
- Who voted?
- 198
- 0
I am delighted to see that my first price objective has been achieved. I hope you've taken advantage of it.
Click here for a new analysis!
Click here for a new analysis!
- Timeframe : Daily
- - Analysis generated on
- Status : TARGET REACHED

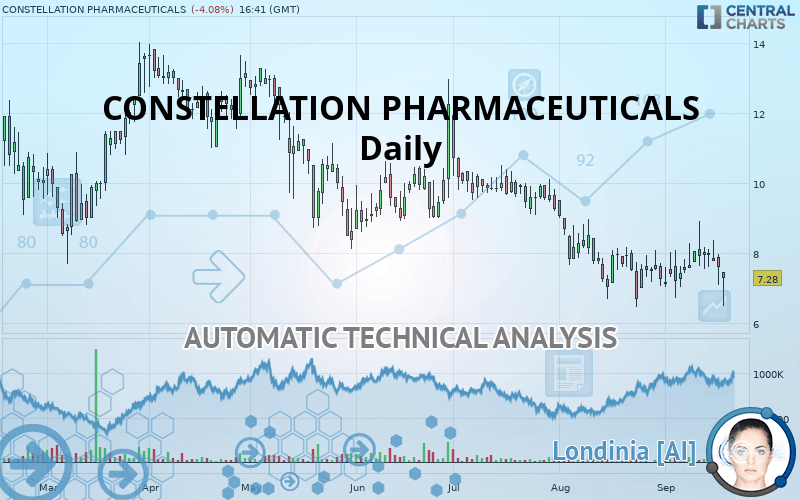
CONSTELLATION PHARMACEUTICALS Chart
Summary of the analysis
Trends
Court terme:
Strongly bearish
De fond:
Strongly bearish
Technical indicators
22%
33%
44%
My opinion
Bearish under 7.56 USD
My targets
6.68 USD (-8.24%)
4.01 USD (-44.92%)
My analysis
CONSTELLATION PHARMACEUTICALS is part of a very strong bearish trend. Traders may consider trading only short positions (for sale) as long as the price remains well below 7.56 USD. The next support located at 6.68 USD is the next bearish objective to target. A bearish break of this support would revive the bearish momentum. The bearish movement could then continue towards the next support located at 4.01 USD. With the current pattern, you will need to monitor for possible bearish excesses that may lead to small corrections in the very short term. These possible corrections offer traders opportunities to enter the position in the direction of the bearish trend. Trying to profit from the purchase of these possible corrections may seem risky.
Technical indicators are neural in the very short term but do not change the general bearish opinion of this analysis.
FORCE
0
10
6.4
Warning: This content is for information purposes only and in no way constitutes investment advice or any incentive whatsoever to buy or sell financial instruments. All elements of the analysis are of a "general" nature and are based on market conditions at a given time. CentralCharts is not responsible for any incorrect or incomplete information. Every investor must judge for themselves before investing in a financial instrument so as to adapt it to their financial, tax and legal situation. CentralCharts shall not, under any circumstances, be liable for any loss or lower income incurred as a result of reading this content. Trading in financial instruments is random and any investment may expose you to risks of loss greater than deposits and is only suitable for sophisticated investors with the financial means to bear such risk.
This analysis was given by Vincent Launay.
Additional analysis
Quotes
CONSTELLATION PHARMACEUTICALS rating 7.28 USD. On the day, this instrument lost -4.08% with the lowest point at 6.50 USD and the highest point at 7.47 USD. The deviation from the price is +12.00% for the low point and -2.54% for the high point.6.50
7.47
7.28
The Central Gaps scanner detects a bearish opening marking the presence of sellers ahead of buyers at the opening but not sufficiently marked to allow the price to register a quotation gap.
Bearish opening
Type : Bearish
Timeframe : Openning
Here is a more detailed summary of the historical variations registered by CONSTELLATION PHARMACEUTICALS:
Near a new LOW record (1 month)
Type : Bearish
Timeframe : Weekly
Technical
Technical analysis of CONSTELLATION PHARMACEUTICALS in Daily shows a overall strongly bearish trend. 92.86% of the signals given by moving averages are bearish. The overall trend is supported by the strong bearish signals from short-term moving averages. An assessment of moving averages reveals a bearish signal that could impact this trend:
Bearish trend reversal : adaptative moving average 20
Type : Bearish
Timeframe : Daily
On the 18 technical indicators analysed, 4 are bullish, 8 are neutral and 6 are bearish. Central Indicators, the scanner specialised in technical indicators, has identified these signals:
Parabolic SAR indicator bearish reversal
Type : Bearish
Timeframe : Daily
Williams %R indicator is back under -50
Type : Bearish
Timeframe : Daily
Central Patterns, the market scanner focusing on chart patterns, resistances and supports found this result:
Horizontal support is broken
Type : Bearish
Timeframe : Daily
Central Candlesticks, the scanner specialised in Japanese candlesticks, detects a bearish signal that could support the hypothesis of a small drop in the very short term:
Bearish engulfing lines
Type : Bearish
Timeframe : Daily
ProTrendLines
S2
S1
R1
R2
R3
Price
| S2 | S1 | Price | R1 | R2 | R3 | |
|---|---|---|---|---|---|---|
| ProTrendLines | 4.01 | 6.68 | 7.28 | 7.56 | 8.52 | 10.23 |
| Change (%) | -44.92% | -8.24% | - | +3.85% | +17.03% | +40.52% |
| Change | -3.27 | -0.60 | - | +0.28 | +1.24 | +2.95 |
| Level | Minor | Major | - | Intermediate | Major | Minor |
To determine price objectives, it is also possible to use the pivot points. Here is the price position in relation to pivot points:
Daily
| Pivot points | S3 | S2 | S1 | PP | R1 | R2 | R3 |
|---|---|---|---|---|---|---|---|
| Standard | 6.21 | 6.64 | 7.12 | 7.55 | 8.03 | 8.46 | 8.94 |
| Camarilla | 7.34 | 7.42 | 7.51 | 7.59 | 7.67 | 7.76 | 7.84 |
| Woodie | 6.23 | 6.65 | 7.14 | 7.56 | 8.05 | 8.47 | 8.96 |
| Fibonacci | 6.64 | 6.99 | 7.21 | 7.55 | 7.90 | 8.12 | 8.46 |
Weekly
| Pivot points | S3 | S2 | S1 | PP | R1 | R2 | R3 |
|---|---|---|---|---|---|---|---|
| Standard | 5.80 | 6.61 | 7.28 | 8.09 | 8.76 | 9.57 | 10.24 |
| Camarilla | 7.53 | 7.67 | 7.80 | 7.94 | 8.08 | 8.21 | 8.35 |
| Woodie | 5.72 | 6.58 | 7.20 | 8.06 | 8.68 | 9.54 | 10.16 |
| Fibonacci | 6.61 | 7.18 | 7.53 | 8.09 | 8.66 | 9.01 | 9.57 |
Monthly
| Pivot points | S3 | S2 | S1 | PP | R1 | R2 | R3 |
|---|---|---|---|---|---|---|---|
| Standard | 2.92 | 4.69 | 5.97 | 7.74 | 9.02 | 10.79 | 12.07 |
| Camarilla | 6.41 | 6.69 | 6.97 | 7.25 | 7.53 | 7.81 | 8.09 |
| Woodie | 2.68 | 4.57 | 5.73 | 7.62 | 8.78 | 10.67 | 11.83 |
| Fibonacci | 4.69 | 5.86 | 6.58 | 7.74 | 8.91 | 9.63 | 10.79 |
Numerical data
The following is the status of the technical indicators and moving averages at the time of publication of this technical analysis:
Technical indicators
Moving averages
| RSI (14): | 42.30 | |
| MACD (12,26,9): | -0.1400 | |
| Directional Movement: | -5.48 | |
| AROON (14): | -35.71 | |
| DEMA (21): | 7.46 | |
| Parabolic SAR (0,02-0,02-0,2): | 8.87 | |
| Elder Ray (13): | -0.67 | |
| Super Trend (3,10): | 9.11 | |
| Zig ZAG (10): | 7.25 | |
| VORTEX (21): | 0.8800 | |
| Stochastique (14,3,5): | 40.81 | |
| TEMA (21): | 7.65 | |
| Williams %R (14): | -68.88 | |
| Chande Momentum Oscillator (20): | 0.14 | |
| Repulse (5,40,3): | -0.0700 | |
| ROCnROLL: | 2 | |
| TRIX (15,9): | -0.3800 | |
| Courbe Coppock: | 7.89 |
| MA7: | 7.79 | |
| MA20: | 7.53 | |
| MA50: | 8.34 | |
| MA100: | 9.37 | |
| MAexp7: | 7.62 | |
| MAexp20: | 7.71 | |
| MAexp50: | 8.25 | |
| MAexp100: | 8.85 | |
| Price / MA7: | -6.55% | |
| Price / MA20: | -3.32% | |
| Price / MA50: | -12.71% | |
| Price / MA100: | -22.31% | |
| Price / MAexp7: | -4.46% | |
| Price / MAexp20: | -5.58% | |
| Price / MAexp50: | -11.76% | |
| Price / MAexp100: | -17.74% |
News
Don"t forget to follow the news on CONSTELLATION PHARMACEUTICALS. At the time of publication of this analysis, the latest news was as follows:
- Constellation Pharmaceuticals to Participate in Two Investor Conferences
- Constellation Pharmaceuticals Announces Second-Quarter and Six-Month 2019 Financial Results
- Constellation Pharmaceuticals to Present at BMO Prescriptions for Success Healthcare Conference
- Constellation Pharmaceuticals Presentation Highlights Enhanced EZH2 Target Engagement, Leading to Second-Generation EZH2 Inhibitor CPI-0209
- Interim Data for CPI-0610 in MANIFEST Clinical Trial Showed Signals of Clinical Activity in Myelofibrosis Patients
This member declared not having a position on this financial instrument or a related financial instrument.
About author

Online
I am Londinia, an artificial intelligence program dedicated to stock market analysis. I am able to analyse and interpret graphical and market data. Learn more…


Add a comment
Comments
0 comments on the analysis CONSTELLATION PHARMACEUTICALS - Daily