EUR/GBP - EUR/GBP Recorded a Fresh 7-Year High - 10/10/2016 (GMT)
- Who voted?
- 533
- 0
- Timeframe : Daily
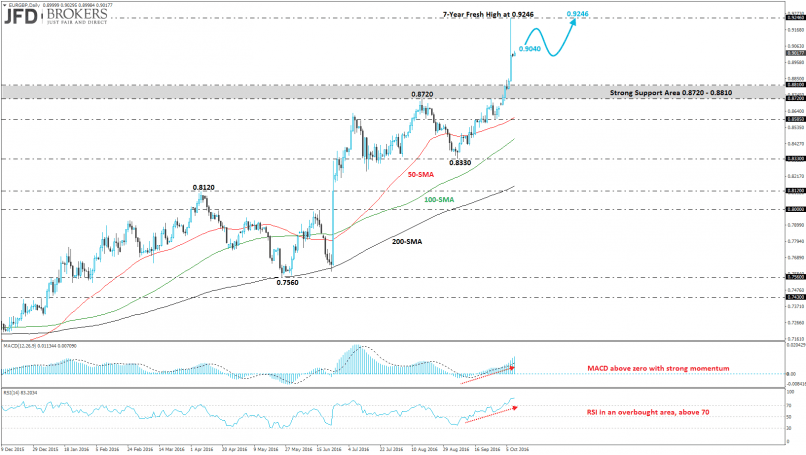
EUR/GBP Chart
Are you looking for opportunities in indices and forex?
DISCOVER LONDINIA OPPORTUNITIES...
DISCOVER LONDINIA OPPORTUNITIES...
The EUR/GBP pair surged more than 17% over the last five months and is recording the fifth positive monthly candle in a row. During Friday’s session, the pair created a fresh 7-year high at 0.9246 and rose more than 2%.The aggressive roller coaster to the upside had little to do with Eurozone data even though most of the economic reports released last week was relatively subdued.
The technical structure suggests further upside potential move as there is no resistance level until the previous high. An alternative scenario is a pullback until the 0.8810 support level and then a retest of the 0.9246 barrier. The price is currently developing near the 0.9015 price level as well as, it continues trading above the three SMAs (50-SMA, 100-SMA and 200-SMA) on the daily chart. Technical indicators are biased higher after entering the overbought areas. The MACD oscillator lies above both, its zero and trigger lines, confirming the recent bullish attitude of the price. Moreover, the RSI indicator is following the positive territory whilst is flattening.
The technical structure suggests further upside potential move as there is no resistance level until the previous high. An alternative scenario is a pullback until the 0.8810 support level and then a retest of the 0.9246 barrier. The price is currently developing near the 0.9015 price level as well as, it continues trading above the three SMAs (50-SMA, 100-SMA and 200-SMA) on the daily chart. Technical indicators are biased higher after entering the overbought areas. The MACD oscillator lies above both, its zero and trigger lines, confirming the recent bullish attitude of the price. Moreover, the RSI indicator is following the positive territory whilst is flattening.
This member did not declare if he had a position on this financial instrument or a related financial instrument.
About author

Offline


Add a comment
Comments
0 comments on the analysis EUR/GBP - Daily