EUR/GBP - Had a Sharp Bearish Run - Next Level 0.8300 - 04/19/2017 (GMT)
- Who voted?
- 444
- 0
- Timeframe : Daily

EUR/GBP Chart
Are you looking for opportunities in indices and forex?
DISCOVER LONDINIA OPPORTUNITIES...
DISCOVER LONDINIA OPPORTUNITIES...
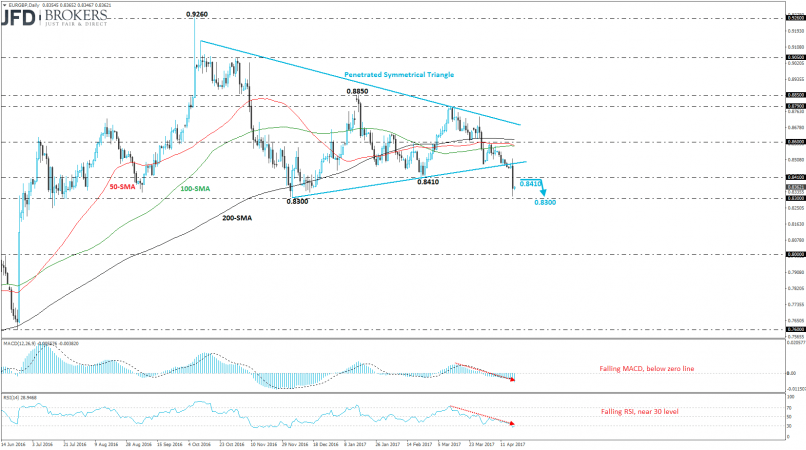
Euro plunged more than 1.3% against the sterling on Tuesday and broke the symmetrical triangle, which was holding since October 2016, to the downside. The EUR/GBP pair is recording the second red week in a row and is trading slightly above the 0.8300 strong psychological level.
From the technical point of view, the three moving averages are moving near the 0.8600 resistance level and the price is developing fairly lower. Our expectation is a retracement until the 0.8410 resistance level and then a continuation of the bearish move back to 0.8300. The technical indicators seem to be in agreement with the bearish scenario. MACD dropped below both, its trigger and zero lines whilst RSI entered the oversold area and now is pointing up.
From the technical point of view, the three moving averages are moving near the 0.8600 resistance level and the price is developing fairly lower. Our expectation is a retracement until the 0.8410 resistance level and then a continuation of the bearish move back to 0.8300. The technical indicators seem to be in agreement with the bearish scenario. MACD dropped below both, its trigger and zero lines whilst RSI entered the oversold area and now is pointing up.
This member did not declare if he had a position on this financial instrument or a related financial instrument.
About author

Offline


Add a comment
Comments
0 comments on the analysis EUR/GBP - Daily