EUR/GBP - on Possible Retracement - Next Target the 0.9140 Key Level - 08/31/2017 (GMT)
- Who voted?
- 325
- 0
- Timeframe : Daily
EUR/GBP Chart
Are you looking for opportunities in indices and forex?
DISCOVER LONDINIA OPPORTUNITIES...
DISCOVER LONDINIA OPPORTUNITIES...
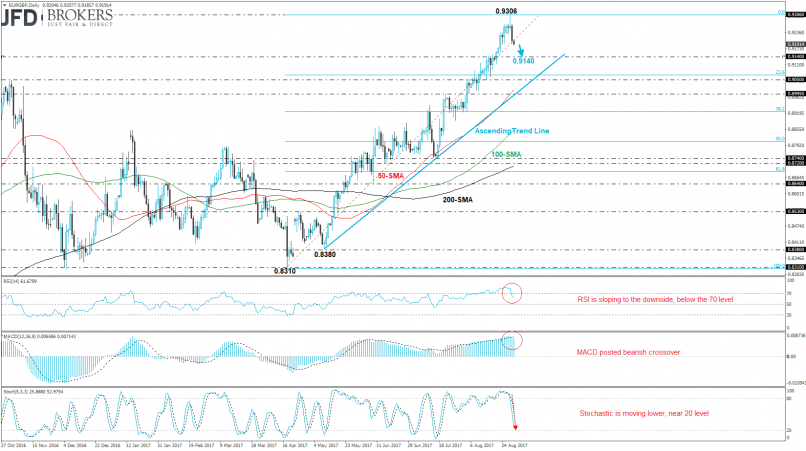
The EUR/GBP pair edged higher during the previous days and weeks and breached 0.9306 resistance, reaching its highest level since October 2009, new eight-year high. Sterling surged in the face of U.S. dollar strength and this drove EUR/GBP lower. The retracement began after the pullback on the latter level and the price is trading towards the 0.9140 support level.
From a technical point of view, on the daily chart, the three simple moving averages (50, 100 and 200) are acting as strong support level and are pointing to the upside. On the other hand, the indicators are weakening its bullish momentum. The RSI indicator head sharply lower, below the 70 level, whilst the MACD oscillator posted a bearish crossover with its trigger line. The stochastic oscillator plunged from the positive area and is near the negative.
From a technical point of view, on the daily chart, the three simple moving averages (50, 100 and 200) are acting as strong support level and are pointing to the upside. On the other hand, the indicators are weakening its bullish momentum. The RSI indicator head sharply lower, below the 70 level, whilst the MACD oscillator posted a bearish crossover with its trigger line. The stochastic oscillator plunged from the positive area and is near the negative.
This member did not declare if he had a position on this financial instrument or a related financial instrument.
About author

Offline


Add a comment
Comments
0 comments on the analysis EUR/GBP - Daily