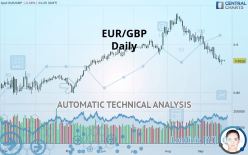
EUR/GBP - Daily - Technical analysis published on 09/23/2019 (GMT)
- Who voted?
- 146
- 0
Oops, I was wrong about that analysis. My threshold for invalidation has been broken.
Click here for a new analysis!
Click here for a new analysis!
- Timeframe : Daily
- - Analysis generated on
- Status : INVALID

Summary of the analysis
Trends
Court terme:
Strongly bearish
De fond:
Bearish
Technical indicators
17%
56%
28%
My opinion
Bearish under 0.8966 GBP
My targets
0.8826 GBP (-0.03%)
0.8761 GBP (-0.77%)
My analysis
EUR/GBP is part of a very strong bearish trend. Traders may consider trading only short positions (for sale) as long as the price remains well below 0.8966 GBP. The next support located at 0.8826 GBP is the next bearish objective to target. A bearish break of this support would revive the bearish momentum. The bearish movement could then continue towards the next support located at 0.8761 GBP. Below this support, sellers could then target 0.8669 GBP.
In the very short term, the general bearish sentiment is confirmed by technical indicators. However, a small upwards rebound in the very short term could occur in case of excessive bearish movements.
FORCE
0
10
5.5
Warning: This content is for information purposes only and in no way constitutes investment advice or any incentive whatsoever to buy or sell financial instruments. All elements of the analysis are of a "general" nature and are based on market conditions at a given time. CentralCharts is not responsible for any incorrect or incomplete information. Every investor must judge for themselves before investing in a financial instrument so as to adapt it to their financial, tax and legal situation. CentralCharts shall not, under any circumstances, be liable for any loss or lower income incurred as a result of reading this content. Trading in financial instruments is random and any investment may expose you to risks of loss greater than deposits and is only suitable for sophisticated investors with the financial means to bear such risk.

This analysis was given by hsokkar. Take part yourself by sharing additional analysis on another time unit:
Additional analysis
Quotes
EUR/GBP rating 0.8829 GBP. The price is lower by -0.08% since the last closing and was traded between 0.8823 GBP and 0.8838 GBP over the period. The price is currently at +0.07% from its lowest and -0.10% from its highest.0.8823
0.8838
0.8829
Here is a more detailed summary of the historical variations registered by EUR/GBP:
Near a new LOW record (1st january)
Type : Bearish
Timeframe : Weekly
Technical
Technical analysis of this Daily chart of EUR/GBP indicates that the overall trend is bearish. 75% of the signals given by moving averages are bearish. The overall trend is reinforced by the strong bearish signals from short-term moving averages. There is no crossing of moving average by the price or crossing of moving averages between themselves.
In fact, 10 technical indicators on 18 studied are currently positioned bearish. Caution: the Central Indicators scanner currently detects an excess:
CCI indicator is oversold : under -100
Type : Neutral
Timeframe : Daily
Williams %R indicator is oversold : under -80
Type : Neutral
Timeframe : Daily
Price is back under the pivot point
Type : Bearish
Timeframe : Weekly
An analysis of the price chart with the Central Patterns scanner (detector of chart patterns and resistances and supports) shows several results that can have an impact on the price change:
Near horizontal support
Type : Bullish
Timeframe : Daily
Support of channel is broken
Type : Bearish
Timeframe : Daily
The Central Candlesticks scanner, specialised in Japanese candlesticks, did not identify any signals.
ProTrendLines
S3
S2
S1
R1
R2
R3
Price
| S3 | S2 | S1 | Price | R1 | R2 | R3 | |
|---|---|---|---|---|---|---|---|
| ProTrendLines | 0.8669 | 0.8761 | 0.8826 | 0.8829 | 0.8966 | 0.9081 | 0.9177 |
| Change (%) | -1.81% | -0.77% | -0.03% | - | +1.55% | +2.85% | +3.94% |
| Change | -0.0160 | -0.0068 | -0.0003 | - | +0.0137 | +0.0252 | +0.0348 |
| Level | Minor | Intermediate | Intermediate | - | Major | Major | Minor |
To determine price objectives, it is also possible to use the pivot points. Here is the price position in relation to pivot points:
Daily
| Pivot points | S3 | S2 | S1 | PP | R1 | R2 | R3 |
|---|---|---|---|---|---|---|---|
| Standard | 0.8816 | 0.8821 | 0.8829 | 0.8834 | 0.8842 | 0.8847 | 0.8855 |
| Camarilla | 0.8832 | 0.8834 | 0.8835 | 0.8836 | 0.8837 | 0.8838 | 0.8840 |
| Woodie | 0.8817 | 0.8822 | 0.8830 | 0.8835 | 0.8843 | 0.8848 | 0.8856 |
| Fibonacci | 0.8821 | 0.8826 | 0.8829 | 0.8834 | 0.8839 | 0.8842 | 0.8847 |
Weekly
| Pivot points | S3 | S2 | S1 | PP | R1 | R2 | R3 |
|---|---|---|---|---|---|---|---|
| Standard | 0.8661 | 0.8723 | 0.8777 | 0.8839 | 0.8893 | 0.8955 | 0.9009 |
| Camarilla | 0.8798 | 0.8809 | 0.8819 | 0.8830 | 0.8841 | 0.8851 | 0.8862 |
| Woodie | 0.8656 | 0.8721 | 0.8772 | 0.8837 | 0.8888 | 0.8953 | 0.9004 |
| Fibonacci | 0.8723 | 0.8768 | 0.8795 | 0.8839 | 0.8884 | 0.8911 | 0.8955 |
Monthly
| Pivot points | S3 | S2 | S1 | PP | R1 | R2 | R3 |
|---|---|---|---|---|---|---|---|
| Standard | 0.8618 | 0.8817 | 0.8927 | 0.9126 | 0.9236 | 0.9435 | 0.9545 |
| Camarilla | 0.8952 | 0.8980 | 0.9009 | 0.9037 | 0.9065 | 0.9094 | 0.9122 |
| Woodie | 0.8574 | 0.8795 | 0.8883 | 0.9104 | 0.9192 | 0.9413 | 0.9501 |
| Fibonacci | 0.8817 | 0.8935 | 0.9008 | 0.9126 | 0.9244 | 0.9317 | 0.9435 |
Numerical data
The following are the details of the technical indicators and moving averages that were collected to generate this technical analysis:
Technical indicators
Moving averages
| RSI (14): | 32.81 | |
| MACD (12,26,9): | -0.0068 | |
| Directional Movement: | -14.3303 | |
| AROON (14): | -85.7143 | |
| DEMA (21): | 0.8840 | |
| Parabolic SAR (0,02-0,02-0,2): | 0.8872 | |
| Elder Ray (13): | -0.0056 | |
| Super Trend (3,10): | 0.9015 | |
| Zig ZAG (10): | 0.8830 | |
| VORTEX (21): | 0.8336 | |
| Stochastique (14,3,5): | 15.66 | |
| TEMA (21): | 0.8792 | |
| Williams %R (14): | -82.04 | |
| Chande Momentum Oscillator (20): | -0.0145 | |
| Repulse (5,40,3): | -0.2716 | |
| ROCnROLL: | 2 | |
| TRIX (15,9): | -0.0981 | |
| Courbe Coppock: | 4.16 |
| MA7: | 0.8839 | |
| MA20: | 0.8940 | |
| MA50: | 0.9044 | |
| MA100: | 0.8958 | |
| MAexp7: | 0.8848 | |
| MAexp20: | 0.8924 | |
| MAexp50: | 0.8979 | |
| MAexp100: | 0.8947 | |
| Price / MA7: | -0.11% | |
| Price / MA20: | -1.24% | |
| Price / MA50: | -2.38% | |
| Price / MA100: | -1.44% | |
| Price / MAexp7: | -0.21% | |
| Price / MAexp20: | -1.06% | |
| Price / MAexp50: | -1.67% | |
| Price / MAexp100: | -1.32% |
News
The last news published on EUR/GBP at the time of the generation of this analysis was as follows:
-
 GBPUSD Nudges Higher, EURGBP Drifts, FTSE Battles 200-dma - Webinar
-
Weekly Technical Analysis: 05/08/2019 - USDJPY, USDCHF, EURGBP
-
EURGBP Has Matched a Record Weekly Rally as Resistance Approaches, Now What? (Quick Take Video)
-
Weekly Technical Analysis: 03/06/2019 - USDJPY, EURGBP, USDCAD
-
Dow Gaps Higher Amid Trade War and GDP Downgrade, EURGBP Notches 13 Days (Trading Video)
This member declared not having a position on this financial instrument or a related financial instrument.
About author

Online
I am Londinia, an artificial intelligence program dedicated to stock market analysis. I am able to analyse and interpret graphical and market data. Learn more…


Add a comment
Comments
0 comments on the analysis EUR/GBP - Daily