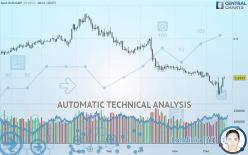
EUR/GBP - Daily - Technical analysis published on 12/18/2019 (GMT)
- Who voted?
- 165
- 0
Click here for a new analysis!
- Timeframe : Daily
- - Analysis generated on
- Status : LEVEL MAINTAINED

Summary of the analysis

Additional analysis
Quotes
The EUR/GBP price is 0.8499 GBP. The price registered an increase of +0.01% on the session and was between 0.8484 GBP and 0.8518 GBP. This implies that the price is at +0.18% from its lowest and at -0.22% from its highest.Here is a more detailed summary of the historical variations registered by EUR/GBP:
Near a new LOW record (1st january)
Type : Bearish
Timeframe : Weekly
Technical
Technical analysis of this Daily chart of EUR/GBP indicates that the overall trend is bearish. 75% of the signals given by moving averages are bearish. Caution: the neutral signals currently given by short-term moving averages show us that the global trend is losing momentum. An assessment of moving averages reveals several bullish signals that could impact this trend:
Bullish trend reversal : adaptative moving average 20
Type : Bullish
Timeframe : Daily
Bullish price crossover with Moving Average 20
Type : Bullish
Timeframe : Daily
In fact, 10 technical indicators on 18 studied are currently bullish. But beware of excesses. The Central Indicators scanner currently detects this:
Williams %R indicator is overbought : over -20
Type : Neutral
Timeframe : Daily
Pivot points : price is over resistance 1
Type : Neutral
Timeframe : Weekly
RSI indicator is back over 50
Type : Bullish
Timeframe : Daily
MACD crosses UP its Moving Average
Type : Bullish
Timeframe : Daily
Parabolic SAR indicator bullish reversal
Type : Bullish
Timeframe : Daily
Price is back over the pivot point
Type : Bullish
Timeframe : Daily
Price is back under the pivot point
Type : Bearish
Timeframe : Weekly
Williams %R indicator is back over -50
Type : Bullish
Timeframe : Daily
An analysis of the price chart with the Central Patterns scanner (detector of chart patterns and resistances and supports) shows several results that can have an impact on the price change:
Near horizontal support
Type : Bullish
Timeframe : Daily
Support of channel is broken
Type : Bearish
Timeframe : Daily
The Central Candlesticks scanner which studies Japanese candlesticks did not detect anything.
| S3 | S2 | S1 | Price | R1 | R2 | R3 | |
|---|---|---|---|---|---|---|---|
| ProTrendLines | 0.7777 | 0.8089 | 0.8359 | 0.8499 | 0.8500 | 0.8592 | 0.8761 |
| Change (%) | -8.50% | -4.82% | -1.65% | - | +0.01% | +1.09% | +3.08% |
| Change | -0.0722 | -0.0410 | -0.0140 | - | +0.0001 | +0.0093 | +0.0262 |
| Level | Major | Minor | Major | - | Intermediate | Major | Major |
To determine price objectives, it is also possible to use the pivot points. Here is the price position in relation to pivot points:
| Pivot points | S3 | S2 | S1 | PP | R1 | R2 | R3 |
|---|---|---|---|---|---|---|---|
| Standard | 0.8285 | 0.8333 | 0.8415 | 0.8463 | 0.8545 | 0.8593 | 0.8675 |
| Camarilla | 0.8462 | 0.8474 | 0.8486 | 0.8498 | 0.8510 | 0.8522 | 0.8534 |
| Woodie | 0.8303 | 0.8342 | 0.8433 | 0.8472 | 0.8563 | 0.8602 | 0.8693 |
| Fibonacci | 0.8333 | 0.8382 | 0.8413 | 0.8463 | 0.8512 | 0.8543 | 0.8593 |
| Pivot points | S3 | S2 | S1 | PP | R1 | R2 | R3 |
|---|---|---|---|---|---|---|---|
| Standard | 0.8007 | 0.8142 | 0.8239 | 0.8374 | 0.8471 | 0.8606 | 0.8703 |
| Camarilla | 0.8272 | 0.8294 | 0.8315 | 0.8336 | 0.8357 | 0.8379 | 0.8400 |
| Woodie | 0.7988 | 0.8133 | 0.8220 | 0.8365 | 0.8452 | 0.8597 | 0.8684 |
| Fibonacci | 0.8142 | 0.8231 | 0.8285 | 0.8374 | 0.8463 | 0.8517 | 0.8606 |
| Pivot points | S3 | S2 | S1 | PP | R1 | R2 | R3 |
|---|---|---|---|---|---|---|---|
| Standard | 0.8299 | 0.8399 | 0.8458 | 0.8558 | 0.8617 | 0.8717 | 0.8776 |
| Camarilla | 0.8473 | 0.8488 | 0.8502 | 0.8517 | 0.8532 | 0.8546 | 0.8561 |
| Woodie | 0.8279 | 0.8389 | 0.8438 | 0.8548 | 0.8597 | 0.8707 | 0.8756 |
| Fibonacci | 0.8399 | 0.8460 | 0.8497 | 0.8558 | 0.8619 | 0.8656 | 0.8717 |
Numerical data
The following are the details of the technical indicators and moving averages that were collected to generate this technical analysis:
| RSI (14): | 50.03 | |
| MACD (12,26,9): | -0.0047 | |
| Directional Movement: | -4.0669 | |
| AROON (14): | -64.2857 | |
| DEMA (21): | 0.8405 | |
| Parabolic SAR (0,02-0,02-0,2): | 0.8282 | |
| Elder Ray (13): | 0.0052 | |
| Super Trend (3,10): | 0.8546 | |
| Zig ZAG (10): | 0.8498 | |
| VORTEX (21): | 0.9597 | |
| Stochastique (14,3,5): | 62.04 | |
| TEMA (21): | 0.8411 | |
| Williams %R (14): | -25.84 | |
| Chande Momentum Oscillator (20): | -0.0062 | |
| Repulse (5,40,3): | 1.0650 | |
| ROCnROLL: | -1 | |
| TRIX (15,9): | -0.0913 | |
| Courbe Coppock: | 2.84 |
| MA7: | 0.8415 | |
| MA20: | 0.8477 | |
| MA50: | 0.8566 | |
| MA100: | 0.8793 | |
| MAexp7: | 0.8440 | |
| MAexp20: | 0.8472 | |
| MAexp50: | 0.8577 | |
| MAexp100: | 0.8688 | |
| Price / MA7: | +1.00% | |
| Price / MA20: | +0.26% | |
| Price / MA50: | -0.78% | |
| Price / MA100: | -3.34% | |
| Price / MAexp7: | +0.70% | |
| Price / MAexp20: | +0.32% | |
| Price / MAexp50: | -0.91% | |
| Price / MAexp100: | -2.18% |
News
The latest news and videos published on EUR/GBP at the time of the analysis were as follows:
-
 Weekly Technical Analysis: 02/12/2019 - USDCHF, NZDJPY, EURGBP
-
Weekly Technical Analysis: 11/11/2019 - USDJPY, USDCHF, EURGBP
-
Weekly Technical Analysis: 02/10/2019 - EURUSD, EURGBP, GER30 Index
-
GBPUSD Nudges Higher, EURGBP Drifts, FTSE Battles 200-dma - Webinar
-
Weekly Technical Analysis: 05/08/2019 - USDJPY, USDCHF, EURGBP
About author

Online


Add a comment
Comments
0 comments on the analysis EUR/GBP - Daily