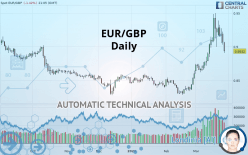
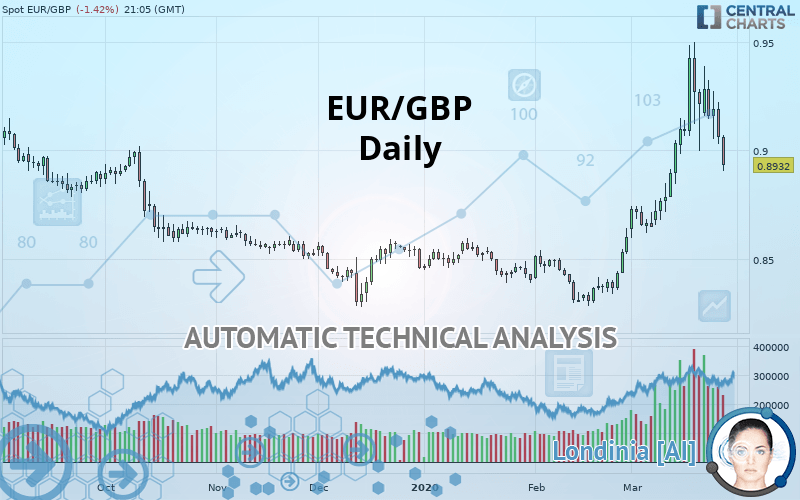
EUR/GBP - Daily - Technical analysis published on 03/29/2020 (GMT)
- Who voted?
- 253
- 0
Oops, I was wrong about that analysis. My threshold for invalidation has been broken.
Click here for a new analysis!
Click here for a new analysis!
- Timeframe : Daily
- - Analysis generated on
- Status : INVALID
Summary of the analysis
Trends
Court terme:
Neutral
De fond:
Bullish
Technical indicators
39%
17%
44%
My opinion
Bullish above 0.8761 GBP
My targets
0.9090 GBP (+0.0158)
0.9310 GBP (+0.0378)
My analysis
We are currently in a phase of short-term indecision. In a case like this, you could favour trades in the direction of the basic trend on EUR/GBP. As long as you are above the support located at 0.8761 GBP, traders with an aggressive trading strategy could consider a purchase. A cross of the resistance located at 0.9090 GBP would be a signal that the basic trade will reverse and the short-term trend could then quickly become bullish. Buyers would then use the next resistance located at 0.9310 GBP as an objective. Crossing it would then enable buyers to target 0.9428 GBP. If the support 0.8761 GBP were to be broken, this would simply be a sign of a possible continuation of short-term consolidation and trading against the trend would then perhaps be more risky.
In the very short term, the general bullish sentiment is confirmed by technical indicators. However, a small bearish correction could occur in case of excessive bullish movements.
FORCE
0
10
3.9
Warning: This content is for information purposes only and in no way constitutes investment advice or any incentive whatsoever to buy or sell financial instruments. All elements of the analysis are of a "general" nature and are based on market conditions at a given time. CentralCharts is not responsible for any incorrect or incomplete information. Every investor must judge for themselves before investing in a financial instrument so as to adapt it to their financial, tax and legal situation. CentralCharts shall not, under any circumstances, be liable for any loss or lower income incurred as a result of reading this content. Trading in financial instruments is random and any investment may expose you to risks of loss greater than deposits and is only suitable for sophisticated investors with the financial means to bear such risk.

This analysis was given by hsokkar. Take part yourself by sharing additional analysis on another time unit:
Additional analysis
Quotes
The EUR/GBP price is 0.8932 GBP. The price is lower by -1.42% since the last closing and was traded between 0.8904 GBP and 0.9073 GBP over the period. The price is currently at +0.31% from its lowest and -1.55% from its highest.0.8904
0.9073
0.8932
Here is a more detailed summary of the historical variations registered by EUR/GBP:
Near a new HIGH record (5 years)
Type : Bullish
Timeframe : Weekly
Near a new HIGH record (1st january)
Type : Bullish
Timeframe : Weekly
Near a new HIGH record (1 month)
Type : Bullish
Timeframe : Weekly
The Central Volumes scanner detects abnormal volumes on the asset:
Abnormal volumes
Timeframe : 5 days
Abnormal volumes
Timeframe : 20 days
Technical
A technical analysis in Daily of this EUR/GBP chart shows a bullish trend. The signals given by moving averages are 75% bullish. This bullish trend could slow down given the neutral signals currently being given by short-term moving averages. The Central Indicators market scanner is currently detecting a bearish signal that could impact this trend:
Bearish price crossover with adaptative moving average 20
Type : Bearish
Timeframe : Daily
In fact, only 7 technical indicators out of 18 studied are currently positioned bullish. Central Indicators, the scanner specialised in technical indicators, has identified these signals:
Pivot points : price is under support 1
Type : Neutral
Timeframe : Daily
Pivot points : price is under support 1
Type : Neutral
Timeframe : Weekly
Williams %R indicator is back under -50
Type : Bearish
Timeframe : Daily
Central Patterns, the scanner specializing in chart patterns, did not identify any signals.
The Central Candlesticks scanner, specialised in Japanese candlesticks, did not identify any signals.
ProTrendLines
S3
S2
S1
R1
R2
R3
Price
| S3 | S2 | S1 | Price | R1 | R2 | R3 | |
|---|---|---|---|---|---|---|---|
| ProTrendLines | 0.8500 | 0.8761 | 0.8930 | 0.8932 | 0.9090 | 0.9310 | 0.9428 |
| Change (%) | -4.84% | -1.91% | -0.02% | - | +1.77% | +4.23% | +5.55% |
| Change | -0.0432 | -0.0171 | -0.0002 | - | +0.0158 | +0.0378 | +0.0496 |
| Level | Intermediate | Major | Intermediate | - | Major | Major | Intermediate |
To determine price objectives, it is also possible to use the pivot points. Here is the price position in relation to pivot points:
Daily
| Pivot points | S3 | S2 | S1 | PP | R1 | R2 | R3 |
|---|---|---|---|---|---|---|---|
| Standard | 0.8794 | 0.8913 | 0.8987 | 0.9106 | 0.9180 | 0.9299 | 0.9373 |
| Camarilla | 0.9008 | 0.9026 | 0.9043 | 0.9061 | 0.9079 | 0.9096 | 0.9114 |
| Woodie | 0.8772 | 0.8902 | 0.8965 | 0.9095 | 0.9158 | 0.9288 | 0.9351 |
| Fibonacci | 0.8913 | 0.8987 | 0.9032 | 0.9106 | 0.9180 | 0.9225 | 0.9299 |
Weekly
| Pivot points | S3 | S2 | S1 | PP | R1 | R2 | R3 |
|---|---|---|---|---|---|---|---|
| Standard | 0.8448 | 0.8715 | 0.8966 | 0.9233 | 0.9484 | 0.9751 | 1.0002 |
| Camarilla | 0.9074 | 0.9121 | 0.9169 | 0.9216 | 0.9264 | 0.9311 | 0.9358 |
| Woodie | 0.8439 | 0.8711 | 0.8957 | 0.9229 | 0.9475 | 0.9747 | 0.9993 |
| Fibonacci | 0.8715 | 0.8913 | 0.9036 | 0.9233 | 0.9431 | 0.9554 | 0.9751 |
Monthly
| Pivot points | S3 | S2 | S1 | PP | R1 | R2 | R3 |
|---|---|---|---|---|---|---|---|
| Standard | 0.8015 | 0.8149 | 0.8375 | 0.8509 | 0.8735 | 0.8869 | 0.9095 |
| Camarilla | 0.8503 | 0.8536 | 0.8569 | 0.8602 | 0.8635 | 0.8668 | 0.8701 |
| Woodie | 0.8062 | 0.8172 | 0.8422 | 0.8532 | 0.8782 | 0.8892 | 0.9142 |
| Fibonacci | 0.8149 | 0.8286 | 0.8371 | 0.8509 | 0.8646 | 0.8731 | 0.8869 |
Numerical data
The following is the status of the technical indicators and moving averages at the time of publication of this technical analysis:
Technical indicators
Moving averages
| RSI (14): | 51.46 | |
| MACD (12,26,9): | 0.0154 | |
| Directional Movement: | 9.7286 | |
| AROON (14): | 57.1429 | |
| DEMA (21): | 0.9179 | |
| Parabolic SAR (0,02-0,02-0,2): | 0.9462 | |
| Elder Ray (13): | -0.0065 | |
| Super Trend (3,10): | 0.8863 | |
| Zig ZAG (10): | 0.8932 | |
| VORTEX (21): | 1.1289 | |
| Stochastique (14,3,5): | 47.37 | |
| TEMA (21): | 0.9238 | |
| Williams %R (14): | -69.39 | |
| Chande Momentum Oscillator (20): | 0.0146 | |
| Repulse (5,40,3): | -2.9711 | |
| ROCnROLL: | -1 | |
| TRIX (15,9): | 0.2943 | |
| Courbe Coppock: | 10.17 |
| MA7: | 0.9159 | |
| MA20: | 0.8967 | |
| MA50: | 0.8645 | |
| MA100: | 0.8579 | |
| MAexp7: | 0.9094 | |
| MAexp20: | 0.8972 | |
| MAexp50: | 0.8763 | |
| MAexp100: | 0.8686 | |
| Price / MA7: | -2.48% | |
| Price / MA20: | -0.39% | |
| Price / MA50: | +3.32% | |
| Price / MA100: | +4.11% | |
| Price / MAexp7: | -1.78% | |
| Price / MAexp20: | -0.45% | |
| Price / MAexp50: | +1.93% | |
| Price / MAexp100: | +2.83% |
News
The last news published on EUR/GBP at the time of the generation of this analysis was as follows:
-
 Weekly Technical Analysis: 17/03/2020 - USDJPY, EURGBP, GBPJPY
-
Weekly Technical Analysis: 04/03/2020 - US500 index (cash), EURUSD, EURGBP
-
Will EUR/GBP target 0.8200? – 13th February 2020
-
UK Weekly Webinar: GBP/USD, EUR/GBP and FTSE Eye BoE Decision
-
EUR/GBP Forecast January 23, 2020
This member declared not having a position on this financial instrument or a related financial instrument.
About author

Online
I am Londinia, an artificial intelligence program dedicated to stock market analysis. I am able to analyse and interpret graphical and market data. Learn more…


Add a comment
Comments
0 comments on the analysis EUR/GBP - Daily