S&P500 - MINI S&P500 FULL0624 - Daily - Technical analysis published on 12/03/2021 (GMT)
- 185
- 0
Click here for a new analysis!
- Timeframe : Daily
- - Analysis generated on
- Status : INVALID

Summary of the analysis

Additional analysis
Quotes
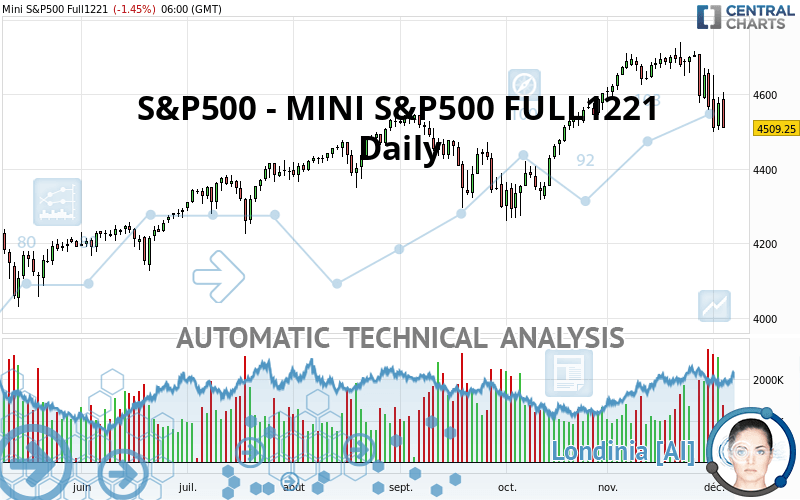
The S&P500 - MINI S&P500 FULL1221 price is 4,509.25 USD. On the day, this instrument lost -1.45% and was between 4,509.00 USD and 4,606.50 USD. This implies that the price is at +0.01% from its lowest and at -2.11% from its highest.A bullish opening was detected by the Central Gaps scanner. Buyers are trying to impose a bullish momentum in the very short term.
Bullish opening
Type : Bullish
Timeframe : Openning
A study of price movements over other periods shows the following variations:
Near a new HIGH record (1st january)
Type : Bullish
Timeframe : Weekly
Technical
Technical analysis of S&P500 - MINI S&P500 FULL1221 in Daily shows an overall slightly bullish trend. 57.14% of the signals given by moving averages are bullish. Caution: the strong bearish signals currently given by short-term moving averages indicate that a trend reversal may be taking place. The Central Indicators market scanner is currently detecting several bullish signals that could impact this trend:
Bullish price crossover with Moving Average 50
Type : Bullish
Timeframe : Daily
Bullish price crossover with adaptative moving average 50
Type : Bullish
Timeframe : Daily
Bullish price crossover with adaptative moving average 100
Type : Bullish
Timeframe : Daily
Technical indicators are bearish. There is still some doubt about the decline in the price.
But beware of excesses. The Central Indicators scanner currently detects this:
CCI indicator is oversold : under -100
Type : Neutral
Timeframe : Daily
RSI indicator: bullish divergence
Type : Bullish
Timeframe : Daily
Pivot points : price is under support 1
Type : Neutral
Timeframe : Daily
Pivot points : price is under support 1
Type : Neutral
Timeframe : Weekly
No signals are given by Central Patterns, a market scanner specialised in chart patterns, resistances and supports.
Central Candlesticks, the scanner specialised in Japanese candlesticks, detects a bullish signal that could support the hypothesis of a small rebound in the very short term:
Bullish harami
Type : Bullish
Timeframe : Daily
| S3 | S2 | S1 | Price | R1 | R2 | |
|---|---|---|---|---|---|---|
| ProTrendLines | 3,880.75 | 4,058.75 | 4,291.25 | 4,509.25 | 4,544.50 | 4,704.70 |
| Change (%) | -13.94% | -9.99% | -4.83% | - | +0.78% | +4.33% |
| Change | -628.50 | -450.50 | -218.00 | - | +35.25 | +195.45 |
| Level | Minor | Intermediate | Intermediate | - | Major | Major |
Pivot points can also be used to set your price objectives. Here is the price situation in relation to pivot points:
| Pivot points | S3 | S2 | S1 | PP | R1 | R2 | R3 |
|---|---|---|---|---|---|---|---|
| Standard | 4,434.67 | 4,470.08 | 4,522.92 | 4,558.33 | 4,611.17 | 4,646.58 | 4,699.42 |
| Camarilla | 4,551.48 | 4,559.57 | 4,567.66 | 4,575.75 | 4,583.84 | 4,591.93 | 4,600.02 |
| Woodie | 4,443.38 | 4,474.44 | 4,531.63 | 4,562.69 | 4,619.88 | 4,650.94 | 4,708.13 |
| Fibonacci | 4,470.08 | 4,503.80 | 4,524.62 | 4,558.33 | 4,592.05 | 4,612.87 | 4,646.58 |
| Pivot points | S3 | S2 | S1 | PP | R1 | R2 | R3 |
|---|---|---|---|---|---|---|---|
| Standard | 4,371.92 | 4,474.58 | 4,535.17 | 4,637.83 | 4,698.42 | 4,801.08 | 4,861.67 |
| Camarilla | 4,550.86 | 4,565.82 | 4,580.79 | 4,595.75 | 4,610.72 | 4,625.68 | 4,640.64 |
| Woodie | 4,350.88 | 4,464.06 | 4,514.13 | 4,627.31 | 4,677.38 | 4,790.56 | 4,840.63 |
| Fibonacci | 4,474.58 | 4,536.95 | 4,575.47 | 4,637.83 | 4,700.20 | 4,738.72 | 4,801.08 |
| Pivot points | S3 | S2 | S1 | PP | R1 | R2 | R3 |
|---|---|---|---|---|---|---|---|
| Standard | 4,181.25 | 4,339.50 | 4,424.00 | 4,582.25 | 4,666.75 | 4,825.00 | 4,909.50 |
| Camarilla | 4,441.74 | 4,464.00 | 4,486.25 | 4,508.50 | 4,530.75 | 4,553.00 | 4,575.26 |
| Woodie | 4,144.38 | 4,321.06 | 4,387.13 | 4,563.81 | 4,629.88 | 4,806.56 | 4,872.63 |
| Fibonacci | 4,339.50 | 4,432.23 | 4,489.52 | 4,582.25 | 4,674.98 | 4,732.27 | 4,825.00 |
Numerical data
The following is the status of technical indicators and moving averages registered at the time this technical analysis was created:
| RSI (14): | 42.04 | |
| MACD (12,26,9): | -2.7800 | |
| Directional Movement: | -10.77 | |
| AROON (14): | -50.00 | |
| DEMA (21): | 4,625.86 | |
| Parabolic SAR (0,02-0,02-0,2): | 4,700.27 | |
| Elder Ray (13): | -48.79 | |
| Super Trend (3,10): | 4,757.86 | |
| Zig ZAG (10): | 4,531.25 | |
| VORTEX (21): | 0.8900 | |
| Stochastique (14,3,5): | 17.13 | |
| TEMA (21): | 4,585.68 | |
| Williams %R (14): | -85.79 | |
| Chande Momentum Oscillator (20): | -153.50 | |
| Repulse (5,40,3): | -2.8500 | |
| ROCnROLL: | 2 | |
| TRIX (15,9): | 0.0800 | |
| Courbe Coppock: | 3.68 |
| MA7: | 4,589.89 | |
| MA20: | 4,650.09 | |
| MA50: | 4,543.13 | |
| MA100: | 4,490.45 | |
| MAexp7: | 4,580.74 | |
| MAexp20: | 4,615.65 | |
| MAexp50: | 4,570.11 | |
| MAexp100: | 4,484.42 | |
| Price / MA7: | -1.76% | |
| Price / MA20: | -3.03% | |
| Price / MA50: | -0.75% | |
| Price / MA100: | +0.42% | |
| Price / MAexp7: | -1.56% | |
| Price / MAexp20: | -2.31% | |
| Price / MAexp50: | -1.33% | |
| Price / MAexp100: | +0.55% |
About author

Online


Add a comment
Comments
0 comments on the analysis S&P500 - MINI S&P500 FULL0624 - Daily