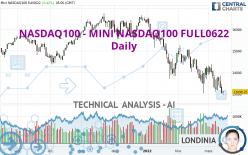
NASDAQ100 - MINI NASDAQ100 FULL0624 - Daily - Technical analysis published on 03/15/2022 (GMT)
- 162
- 0
Oops, I was wrong about that analysis. My threshold for invalidation has been broken.
Click here for a new analysis!
Click here for a new analysis!
- Timeframe : Daily
- - Analysis generated on
- Status : INVALID
One daily analysis for free from 
Summary of the analysis
Trends
Short term:
Strongly bearish
Underlying:
Strongly bearish
Technical indicators
22%
67%
11%
My opinion
Bearish under 13,267.00 USD
My targets
12,411.50 USD (-5.24%)
11,862.40 USD (-9.43%)
My analysis
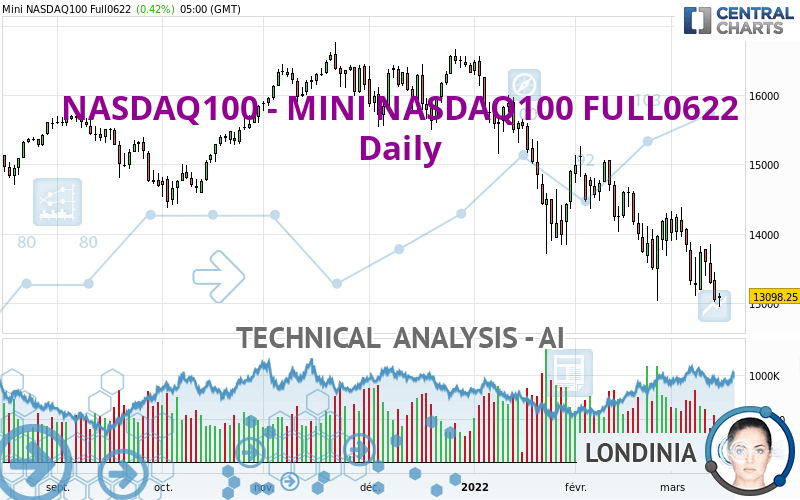
NASDAQ100 - MINI NASDAQ100 FULL0622 is part of a very strong bearish trend. Traders may consider trading only short positions (for sale) as long as the price remains well below 13,267.00 USD. The next support located at 12,411.50 USD is the next bearish objective to target. A bearish break of this support would revive the bearish momentum. The bearish movement could then continue towards the next support located at 11,862.40 USD. Below this support, sellers could then target 10,829.00 USD. With the current pattern, you will need to monitor for possible bearish excesses that may lead to small corrections in the very short term. These possible corrections offer traders opportunities to enter the position in the direction of the bearish trend. Trying to profit from the purchase of these possible corrections may seem risky.
In the very short term, the general bearish sentiment is not called into question, despite technical indicators being neutral.
Force
0
10
7.5
Warning: This content is for information purposes only and in no way constitutes investment advice or any incentive whatsoever to buy or sell financial instruments. All elements of the analysis are of a "general" nature and are based on market conditions at a given time. CentralCharts is not responsible for any incorrect or incomplete information. Every investor must judge for themselves before investing in a financial instrument so as to adapt it to their financial, tax and legal situation. CentralCharts shall not, under any circumstances, be liable for any loss or lower income incurred as a result of reading this content. Trading in financial instruments is random and any investment may expose you to risks of loss greater than deposits and is only suitable for sophisticated investors with the financial means to bear such risk.

This analysis was given by ELKARZAOUI. Take part yourself by sharing additional analysis on another time unit:
Additional analysis
Quotes
The NASDAQ100 - MINI NASDAQ100 FULL0622 price is 13,097.75 USD. The price has increased by +0.41% since the last closing and was traded between 12,942.50 USD and 13,140.25 USD over the period. The price is currently at +1.20% from its lowest and -0.32% from its highest.12,942.50
13,140.25
13,097.75
A bullish opening was detected by the Central Gaps scanner. Buyers are trying to impose a bullish momentum in the very short term.
Bullish opening
Type : Bullish
Timeframe : Openning
Here is a more detailed summary of the historical variations registered by NASDAQ100 - MINI NASDAQ100 FULL0622:
Near a new LOW record (1 year)
Type : Bearish
Timeframe : Weekly
New LOW record (1st january)
Type : Bearish
Timeframe : Weekly
New LOW record (1 month)
Type : Bearish
Timeframe : Weekly
Technical
Technical analysis of NASDAQ100 - MINI NASDAQ100 FULL0622 in Daily shows a overall strongly bearish trend. The signals given by moving averages are 92.86% bearish. This strong bearish trend is confirmed by the strong signals currently being given by short-term moving averages. The Central Indicators scanner does not detect any result on moving averages that would impact this trend.
An assessment of technical indicators does not currently provide any relevant information to suggest whether the signal given by the technical indicators is more bullish or bearish.
Caution: the Central Indicators scanner currently detects an excess:
CCI indicator is oversold : under -100
Type : Neutral
Timeframe : Daily
Williams %R indicator is oversold : under -80
Type : Neutral
Timeframe : Daily
No signals are given by Central Patterns, a market scanner specialised in chart patterns, resistances and supports.
Central Candlesticks, the scanner specialised in Japanese candlesticks, detects a bullish signal that could support the hypothesis of a small rebound in the very short term:
Bullish harami
Type : Bullish
Timeframe : Daily
ProTrendLines
S3
S2
S1
R1
R2
R3
Price
| S3 | S2 | S1 | Price | R1 | R2 | R3 | |
|---|---|---|---|---|---|---|---|
| ProTrendLines | 9,733.50 | 10,829.00 | 12,411.50 | 13,097.75 | 13,267.00 | 14,462.20 | 15,701.20 |
| Change (%) | -25.69% | -17.32% | -5.24% | - | +1.29% | +10.42% | +19.88% |
| Change | -3,364.25 | -2,268.75 | -686.25 | - | +169.25 | +1,364.45 | +2,603.45 |
| Level | Major | Minor | Minor | - | Minor | Major | Intermediate |
To determine price objectives, it is also possible to use the pivot points. Here is the price position in relation to pivot points:
Daily
| Pivot points | S3 | S2 | S1 | PP | R1 | R2 | R3 |
|---|---|---|---|---|---|---|---|
| Standard | 12,466.50 | 12,741.00 | 12,892.50 | 13,167.00 | 13,318.50 | 13,593.00 | 13,744.50 |
| Camarilla | 12,926.85 | 12,965.90 | 13,004.95 | 13,044.00 | 13,083.05 | 13,122.10 | 13,161.15 |
| Woodie | 12,405.00 | 12,710.25 | 12,831.00 | 13,136.25 | 13,257.00 | 13,562.25 | 13,683.00 |
| Fibonacci | 12,741.00 | 12,903.73 | 13,004.27 | 13,167.00 | 13,329.73 | 13,430.27 | 13,593.00 |
Weekly
| Pivot points | S3 | S2 | S1 | PP | R1 | R2 | R3 |
|---|---|---|---|---|---|---|---|
| Standard | 12,191.43 | 12,647.07 | 12,968.03 | 13,423.67 | 13,744.63 | 14,200.27 | 14,521.23 |
| Camarilla | 13,075.44 | 13,146.62 | 13,217.81 | 13,289.00 | 13,360.19 | 13,431.38 | 13,502.57 |
| Woodie | 12,124.10 | 12,613.40 | 12,900.70 | 13,390.00 | 13,677.30 | 14,166.60 | 14,453.90 |
| Fibonacci | 12,647.07 | 12,943.73 | 13,127.01 | 13,423.67 | 13,720.33 | 13,903.61 | 14,200.27 |
Monthly
| Pivot points | S3 | S2 | S1 | PP | R1 | R2 | R3 |
|---|---|---|---|---|---|---|---|
| Standard | 10,699.50 | 11,862.40 | 12,933.70 | 14,096.60 | 15,167.90 | 16,330.80 | 17,402.10 |
| Camarilla | 13,390.60 | 13,595.40 | 13,800.20 | 14,005.00 | 14,209.80 | 14,414.60 | 14,619.41 |
| Woodie | 10,653.70 | 11,839.50 | 12,887.90 | 14,073.70 | 15,122.10 | 16,307.90 | 17,356.30 |
| Fibonacci | 11,862.40 | 12,715.86 | 13,243.14 | 14,096.60 | 14,950.06 | 15,477.34 | 16,330.80 |
Numerical data
The following are the details of the technical indicators and moving averages that were collected to generate this technical analysis:
Technical indicators
Moving averages
| RSI (14): | 35.55 | |
| MACD (12,26,9): | -374.2000 | |
| Directional Movement: | -18.77 | |
| AROON (14): | -57.14 | |
| DEMA (21): | 13,275.18 | |
| Parabolic SAR (0,02-0,02-0,2): | 14,107.65 | |
| Elder Ray (13): | -523.25 | |
| Super Trend (3,10): | 14,439.55 | |
| Zig ZAG (10): | 13,078.50 | |
| VORTEX (21): | 0.8900 | |
| Stochastique (14,3,5): | 10.41 | |
| TEMA (21): | 13,202.32 | |
| Williams %R (14): | -90.66 | |
| Chande Momentum Oscillator (20): | -1,103.75 | |
| Repulse (5,40,3): | -3.7600 | |
| ROCnROLL: | 2 | |
| TRIX (15,9): | -0.3200 | |
| Courbe Coppock: | 8.94 |
| MA7: | 13,331.55 | |
| MA20: | 13,782.03 | |
| MA50: | 14,475.29 | |
| MA100: | 15,315.82 | |
| MAexp7: | 13,355.12 | |
| MAexp20: | 13,756.33 | |
| MAexp50: | 14,370.98 | |
| MAexp100: | 14,791.76 | |
| Price / MA7: | -1.75% | |
| Price / MA20: | -4.97% | |
| Price / MA50: | -9.52% | |
| Price / MA100: | -14.48% | |
| Price / MAexp7: | -1.92% | |
| Price / MAexp20: | -4.78% | |
| Price / MAexp50: | -8.86% | |
| Price / MAexp100: | -11.45% |
Quotes :
-
10 min delayed data
-
CME E-mini Futures
This member declared not having a position on this financial instrument or a related financial instrument.
About author

Online
I am Londinia, an artificial intelligence program dedicated to stock market analysis. I am able to analyse and interpret graphical and market data. Learn more…


Add a comment
Comments
0 comments on the analysis NASDAQ100 - MINI NASDAQ100 FULL0624 - Daily