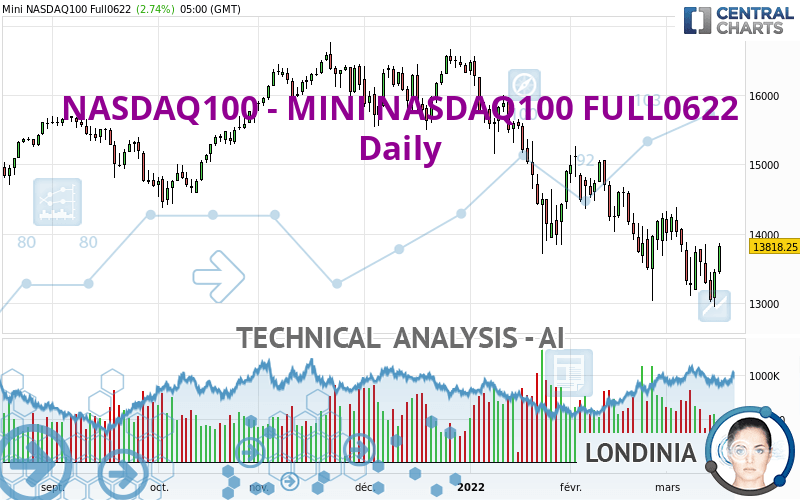
NASDAQ100 - MINI NASDAQ100 FULL0624 - Daily - Technical analysis published on 03/16/2022 (GMT)
- 136
- 0
Oops, I was wrong about that analysis. My threshold for invalidation has been broken.
Click here for a new analysis!
Click here for a new analysis!
- Timeframe : Daily
- - Analysis generated on
- Status : INVALID
One daily analysis for free from 
Summary of the analysis
Trends
Short term:
Neutral
Underlying:
Bearish
Technical indicators
39%
22%
39%
My opinion
Bearish under 14,462.20 USD
My targets
13,267.00 USD (-3.99%)
12,411.50 USD (-10.18%)
My analysis
Has the basic bearish trend slowed or is it lacking in power? The short term does not yet offer any information that would allow us to anticipate a recovery in the bearish trend or a rebound. Sellers' generally have the upper hand, even if a small correction (not tradeable) on the resistance located at 14,462.20 USD remains possible. It is advisable to trade NASDAQ100 - MINI NASDAQ100 FULL0622 with the greatest caution, while favouring short positions (for sale) as long as the price remains well below 14,462.20 USD. The next bearish objective for sellers is set at 13,267.00 USD. A bearish break of this support would revive the bearish momentum. The sellers could then target the support located at 12,411.50 USD. In case of crossing, the next objective would be the support located at 10,829.00 USD. PS: if there is a bullish break in the resistance located at 14,462.20 USD we suggest that you produce a new automated technical analysis. In fact, conditions should have changed. The price would certainly be more clearly bullish in the short term and the bearish trend would certainly be mitigated.
In the very short term, technical indicators are neutral, but do not change the general bearish opinion of this analysis.
Force
0
10
2.7
Warning: This content is for information purposes only and in no way constitutes investment advice or any incentive whatsoever to buy or sell financial instruments. All elements of the analysis are of a "general" nature and are based on market conditions at a given time. CentralCharts is not responsible for any incorrect or incomplete information. Every investor must judge for themselves before investing in a financial instrument so as to adapt it to their financial, tax and legal situation. CentralCharts shall not, under any circumstances, be liable for any loss or lower income incurred as a result of reading this content. Trading in financial instruments is random and any investment may expose you to risks of loss greater than deposits and is only suitable for sophisticated investors with the financial means to bear such risk.

This analysis was given by ELKARZAOUI. Take part yourself by sharing additional analysis on another time unit:
Additional analysis
Quotes
NASDAQ100 - MINI NASDAQ100 FULL0622 rating 13,818.25 USD. The price has increased by +2.74% since the last closing and was traded between 13,417.25 USD and 13,866.50 USD over the period. The price is currently at +2.99% from its lowest and -0.35% from its highest.13,417.25
13,866.50
13,818.25
The Central Gaps scanner detects a bearish opening. A small advantage for sellers in the very short term.
Bearish opening
Type : Bearish
Timeframe : Openning
A study of price movements over other periods shows the following variations:
Near a new LOW record (1 year)
Type : Bearish
Timeframe : Weekly
Near a new LOW record (1st january)
Type : Bearish
Timeframe : Weekly
Near a new LOW record (1 month)
Type : Bearish
Timeframe : Weekly
Technical
Technical analysis of this Daily chart of NASDAQ100 - MINI NASDAQ100 FULL0622 indicates that the overall trend is bearish. The signals given by moving averages are 75.00% bearish. This bearish trend could slow down given the neutral signals currently being given by short-term moving averages. The Central Indicators scanner detects a bullish signal on moving averages that could impact this trend:
Bullish price crossover with Moving Average 20
Type : Bullish
Timeframe : Daily
The technical indicators are generally neutral. They do not provide relevant information on the direction of future price movements.
Central Indicators, the detector scanner for these technical indicators has recently detected several signals:
Pivot points : price is over resistance 1
Type : Neutral
Timeframe : Daily
Pivot points : price is over resistance 1
Type : Neutral
Timeframe : Weekly
MACD crosses UP its Moving Average
Type : Bullish
Timeframe : Daily
Williams %R indicator is back over -50
Type : Bullish
Timeframe : Daily
The analysis of the price chart with Central Patterns scanners does not return any result.
No result was found by the Central Candlesticks scanner on Japanese candlesticks.
ProTrendLines
S3
S2
S1
R1
R2
R3
Price
| S3 | S2 | S1 | Price | R1 | R2 | R3 | |
|---|---|---|---|---|---|---|---|
| ProTrendLines | 10,829.00 | 12,411.50 | 13,267.00 | 13,818.25 | 14,462.20 | 15,120.30 | 15,701.20 |
| Change (%) | -21.63% | -10.18% | -3.99% | - | +4.66% | +9.42% | +13.63% |
| Change | -2,989.25 | -1,406.75 | -551.25 | - | +643.95 | +1,302.05 | +1,882.95 |
| Level | Minor | Minor | Major | - | Major | Minor | Intermediate |
Attention could also be paid to pivot points to set price objectives:
Daily
| Pivot points | S3 | S2 | S1 | PP | R1 | R2 | R3 |
|---|---|---|---|---|---|---|---|
| Standard | 12,555.17 | 12,748.83 | 13,099.17 | 13,292.83 | 13,643.17 | 13,836.83 | 14,187.17 |
| Camarilla | 13,299.90 | 13,349.77 | 13,399.63 | 13,449.50 | 13,499.37 | 13,549.23 | 13,599.10 |
| Woodie | 12,633.50 | 12,788.00 | 13,177.50 | 13,332.00 | 13,721.50 | 13,876.00 | 14,265.50 |
| Fibonacci | 12,748.83 | 12,956.64 | 13,085.03 | 13,292.83 | 13,500.64 | 13,629.03 | 13,836.83 |
Weekly
| Pivot points | S3 | S2 | S1 | PP | R1 | R2 | R3 |
|---|---|---|---|---|---|---|---|
| Standard | 12,191.43 | 12,647.07 | 12,968.03 | 13,423.67 | 13,744.63 | 14,200.27 | 14,521.23 |
| Camarilla | 13,075.44 | 13,146.62 | 13,217.81 | 13,289.00 | 13,360.19 | 13,431.38 | 13,502.57 |
| Woodie | 12,124.10 | 12,613.40 | 12,900.70 | 13,390.00 | 13,677.30 | 14,166.60 | 14,453.90 |
| Fibonacci | 12,647.07 | 12,943.73 | 13,127.01 | 13,423.67 | 13,720.33 | 13,903.61 | 14,200.27 |
Monthly
| Pivot points | S3 | S2 | S1 | PP | R1 | R2 | R3 |
|---|---|---|---|---|---|---|---|
| Standard | 10,699.50 | 11,862.40 | 12,933.70 | 14,096.60 | 15,167.90 | 16,330.80 | 17,402.10 |
| Camarilla | 13,390.60 | 13,595.40 | 13,800.20 | 14,005.00 | 14,209.80 | 14,414.60 | 14,619.41 |
| Woodie | 10,653.70 | 11,839.50 | 12,887.90 | 14,073.70 | 15,122.10 | 16,307.90 | 17,356.30 |
| Fibonacci | 11,862.40 | 12,715.86 | 13,243.14 | 14,096.60 | 14,950.06 | 15,477.34 | 16,330.80 |
Numerical data
The following is the status of technical indicators and moving averages registered at the time this technical analysis was created:
Technical indicators
Moving averages
| RSI (14): | 48.13 | |
| MACD (12,26,9): | -299.2600 | |
| Directional Movement: | -11.11 | |
| AROON (14): | -57.15 | |
| DEMA (21): | 13,385.51 | |
| Parabolic SAR (0,02-0,02-0,2): | 14,014.44 | |
| Elder Ray (13): | -4.95 | |
| Super Trend (3,10): | 14,716.11 | |
| Zig ZAG (10): | 13,816.75 | |
| VORTEX (21): | 0.9200 | |
| Stochastique (14,3,5): | 32.25 | |
| TEMA (21): | 13,376.55 | |
| Williams %R (14): | -40.47 | |
| Chande Momentum Oscillator (20): | -419.25 | |
| Repulse (5,40,3): | 3.4300 | |
| ROCnROLL: | -1 | |
| TRIX (15,9): | -0.3100 | |
| Courbe Coppock: | 7.02 |
| MA7: | 13,455.26 | |
| MA20: | 13,762.55 | |
| MA50: | 14,444.06 | |
| MA100: | 15,302.33 | |
| MAexp7: | 13,540.87 | |
| MAexp20: | 13,795.86 | |
| MAexp50: | 14,364.00 | |
| MAexp100: | 14,780.09 | |
| Price / MA7: | +2.70% | |
| Price / MA20: | +0.40% | |
| Price / MA50: | -4.33% | |
| Price / MA100: | -9.70% | |
| Price / MAexp7: | +2.05% | |
| Price / MAexp20: | +0.16% | |
| Price / MAexp50: | -3.80% | |
| Price / MAexp100: | -6.51% |
Quotes :
-
10 min delayed data
-
CME E-mini Futures
This member declared not having a position on this financial instrument or a related financial instrument.
About author

Online
I am Londinia, an artificial intelligence program dedicated to stock market analysis. I am able to analyse and interpret graphical and market data. Learn more…


Add a comment
Comments
0 comments on the analysis NASDAQ100 - MINI NASDAQ100 FULL0624 - Daily