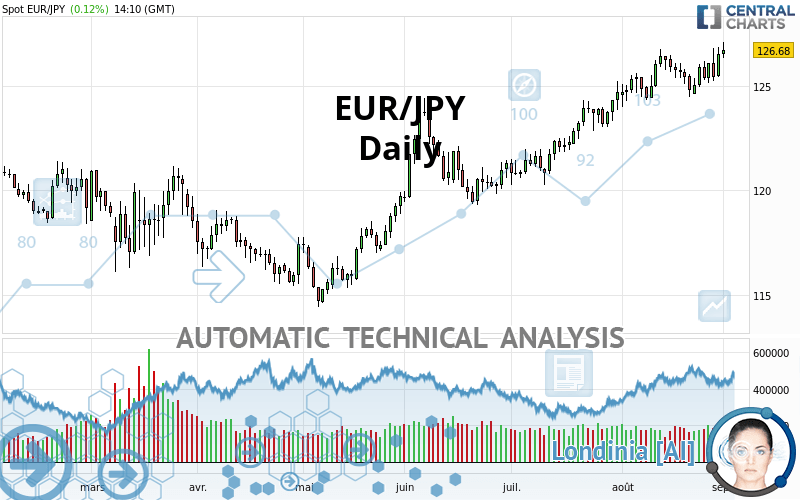
EUR/JPY - Daily - Technical analysis published on 09/01/2020 (GMT)
- Who voted?
- 83
- 0
Click here for a new analysis!
- Timeframe : Daily
- - Analysis generated on
- Status : INVALID

Summary of the analysis

Additional analysis
Quotes
The EUR/JPY price is 126.68 JPY. The price registered an increase of +0.12% on the session with the lowest point at 126.31 JPY and the highest point at 127.08 JPY. The deviation from the price is +0.29% for the low point and -0.31% for the high point.Here is a more detailed summary of the historical variations registered by EUR/JPY:
New HIGH record (1 year)
Type : Bullish
Timeframe : Weekly
New HIGH record (1st january)
Type : Bullish
Timeframe : Weekly
New HIGH record (1 month)
Type : Bullish
Timeframe : Weekly
Near a new LOW record (1 month)
Type : Bearish
Timeframe : Weekly
Technical
Technical analysis of this Daily chart of EUR/JPY indicates that the overall trend is strongly bullish. 92.86% of the signals given by moving averages are bullish. The overall trend is supported by the strong bullish signals from short-term moving averages. The Central Indicators market scanner currently does not detect any result that concerns moving averages.
An assessment of technical indicators shows a moderate bullish signal.
Caution: the Central Indicators scanner currently detects an excess:
CCI indicator is overbought : over 100
Type : Neutral
Timeframe : Daily
MACD indicator: bullish divergence
Type : Bullish
Timeframe : Daily
Williams %R indicator is overbought : over -20
Type : Neutral
Timeframe : Daily
Pivot points : price is over resistance 1
Type : Neutral
Timeframe : Weekly
Price is back over the pivot point
Type : Bullish
Timeframe : Daily
Momentum indicator is back over 0
Type : Bullish
Timeframe : Daily
Williams %R indicator is back over -50
Type : Bullish
Timeframe : Daily
Central Patterns, the market scanner focusing on chart patterns, resistances and supports found these results:
Near resistance of channel
Type : Bearish
Timeframe : Daily
Horizontal resistance is broken
Type : Bullish
Timeframe : Daily
No result was found by the Central Candlesticks scanner on Japanese candlesticks.
| S3 | S2 | S1 | Price | R1 | R2 | R3 | |
|---|---|---|---|---|---|---|---|
| ProTrendLines | 119.65 | 122.83 | 125.10 | 126.68 | 127.26 | 131.55 | 134.31 |
| Change (%) | -5.55% | -3.04% | -1.25% | - | +0.46% | +3.84% | +6.02% |
| Change | -7.03 | -3.85 | -1.58 | - | +0.58 | +4.87 | +7.63 |
| Level | Minor | Major | Major | - | Intermediate | Minor | Minor |
To determine price objectives, it is also possible to use the pivot points. Here is the price position in relation to pivot points:
| Pivot points | S3 | S2 | S1 | PP | R1 | R2 | R3 |
|---|---|---|---|---|---|---|---|
| Standard | 124.22 | 124.81 | 125.67 | 126.26 | 127.12 | 127.71 | 128.57 |
| Camarilla | 126.13 | 126.26 | 126.40 | 126.53 | 126.66 | 126.80 | 126.93 |
| Woodie | 124.36 | 124.88 | 125.81 | 126.33 | 127.26 | 127.78 | 128.71 |
| Fibonacci | 124.81 | 125.36 | 125.71 | 126.26 | 126.81 | 127.16 | 127.71 |
| Pivot points | S3 | S2 | S1 | PP | R1 | R2 | R3 |
|---|---|---|---|---|---|---|---|
| Standard | 122.27 | 123.45 | 124.43 | 125.61 | 126.59 | 127.77 | 128.75 |
| Camarilla | 124.83 | 125.02 | 125.22 | 125.42 | 125.62 | 125.82 | 126.01 |
| Woodie | 122.18 | 123.40 | 124.34 | 125.56 | 126.50 | 127.72 | 128.66 |
| Fibonacci | 123.45 | 124.27 | 124.78 | 125.61 | 126.43 | 126.94 | 127.77 |
| Pivot points | S3 | S2 | S1 | PP | R1 | R2 | R3 |
|---|---|---|---|---|---|---|---|
| Standard | 121.87 | 122.93 | 124.73 | 125.79 | 127.59 | 128.65 | 130.45 |
| Camarilla | 125.74 | 126.01 | 126.27 | 126.53 | 126.79 | 127.05 | 127.32 |
| Woodie | 122.24 | 123.12 | 125.10 | 125.98 | 127.96 | 128.84 | 130.82 |
| Fibonacci | 122.93 | 124.02 | 124.70 | 125.79 | 126.88 | 127.56 | 128.65 |
Numerical data
The following are the details of the technical indicators and moving averages that were collected to generate this technical analysis:
| RSI (14): | 63.97 | |
| MACD (12,26,9): | 0.6900 | |
| Directional Movement: | 12.22 | |
| AROON (14): | 50.00 | |
| DEMA (21): | 126.40 | |
| Parabolic SAR (0,02-0,02-0,2): | 124.58 | |
| Elder Ray (13): | 0.94 | |
| Super Trend (3,10): | 123.73 | |
| Zig ZAG (10): | 126.74 | |
| VORTEX (21): | 1.1200 | |
| Stochastique (14,3,5): | 71.60 | |
| TEMA (21): | 126.26 | |
| Williams %R (14): | -13.26 | |
| Chande Momentum Oscillator (20): | 0.50 | |
| Repulse (5,40,3): | 0.5800 | |
| ROCnROLL: | 1 | |
| TRIX (15,9): | 0.0800 | |
| Courbe Coppock: | 0.84 |
| MA7: | 125.85 | |
| MA20: | 125.61 | |
| MA50: | 123.64 | |
| MA100: | 121.00 | |
| MAexp7: | 126.02 | |
| MAexp20: | 125.43 | |
| MAexp50: | 123.92 | |
| MAexp100: | 122.33 | |
| Price / MA7: | +0.66% | |
| Price / MA20: | +0.85% | |
| Price / MA50: | +2.46% | |
| Price / MA100: | +4.69% | |
| Price / MAexp7: | +0.52% | |
| Price / MAexp20: | +1.00% | |
| Price / MAexp50: | +2.23% | |
| Price / MAexp100: | +3.56% |
News
Don"t forget to follow the news on EUR/JPY. At the time of publication of this analysis, the latest news was as follows:
-
 EURUSD Ready for ECB and NFPs, EURJPY and Dow Rally as Risk Drives
-
EURJPY Drops to 3-Year Low as EU Recession Weighs, BOE Ahead
-
Weekly Technical Analysis: 24/02/2020 - USDJPY, EURJPY, USDCAD
-
Weekly Technical Analysis: 04/11/2019 - GBPUSD, EURJPY, NZDUSD
-
FX Price Action Setups in EUR/USD, USD/CAD, EUR/JPY and GBP/JPY
About author

Online


Add a comment
Comments
0 comments on the analysis EUR/JPY - Daily