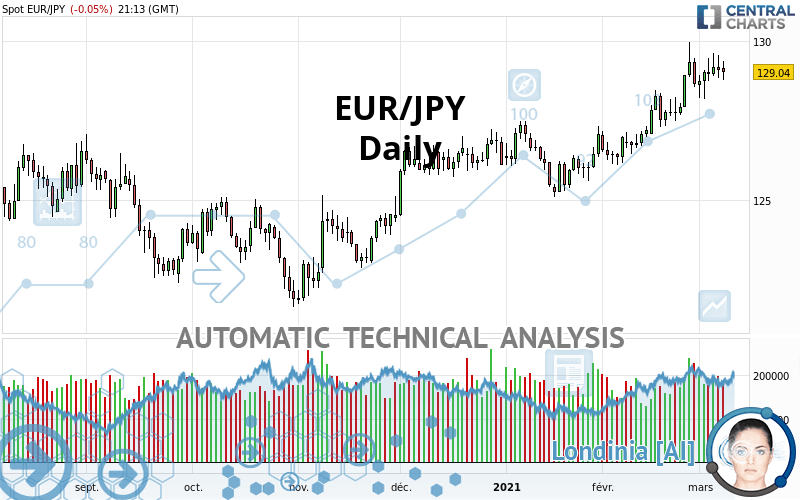
EUR/JPY - Daily - Technical analysis published on 03/08/2021 (GMT)
- 181
- 0
I am pleased to note that the threshold for invalidation has been maintained for 20 Candlesticks.
Click here for a new analysis!
Click here for a new analysis!
- Timeframe : Daily
- - Analysis generated on
- Status : LEVEL MAINTAINED

Summary of the analysis
Trends
Court terme:
Strongly bullish
De fond:
Strongly bullish
Technical indicators
72%
6%
22%
My opinion
Bullish above 126.79 JPY
My targets
131.55 JPY (+2.51)
134.31 JPY (+5.27)
My analysis
All elements being clearly bullish, it would be possible for traders to trade only long positions (at the time of purchase) on EUR/JPY as long as the price remains well above 126.79 JPY. The buyers” bullish objective is set at 131.55 JPY. A bullish break in this resistance would boost the bullish momentum. The buyers could then target the resistance located at 134.31 JPY. If there is any crossing, the next objective would be the resistance located at 137.29 JPY. However, beware of bullish excesses that could lead to a possible short-term correction; but this possible correction would not be tradeable.
Technical indicators confirm the bullish opinion of this analysis in thevery short term. However, be careful of excessive bullish movements. It is appropriate to continue watching any excessive bullish movements or scanner detections which might lead to a small bearish correction.
Force
0
10
8.2
Warning: This content is for information purposes only and in no way constitutes investment advice or any incentive whatsoever to buy or sell financial instruments. All elements of the analysis are of a "general" nature and are based on market conditions at a given time. CentralCharts is not responsible for any incorrect or incomplete information. Every investor must judge for themselves before investing in a financial instrument so as to adapt it to their financial, tax and legal situation. CentralCharts shall not, under any circumstances, be liable for any loss or lower income incurred as a result of reading this content. Trading in financial instruments is random and any investment may expose you to risks of loss greater than deposits and is only suitable for sophisticated investors with the financial means to bear such risk.

This analysis was given by savas. Take part yourself by sharing additional analysis on another time unit:
Additional analysis
Quotes
The EUR/JPY price is 129.04 JPY. The price is lower by -0.05% since the last closing and was between 128.78 JPY and 129.39 JPY. This implies that the price is at +0.20% from its lowest and at -0.27% from its highest.128.78
129.39
129.04
The Central Gaps scanner detects a bullish opening. A small advantage for buyers in the very short term.
Bullish opening
Type : Bullish
Timeframe : Openning
So that you have an overall view of the price change, here is a table showing the variations over several periods:
Technical
A technical analysis in Daily of this EUR/JPY chart shows a strongly bullish trend. The signals given by the moving averages are 92.86% bullish. This strong bullish trend is confirmed by the strong signals currently being given by short-term moving averages. The Central Indicators market scanner currently does not detect any result that concerns moving averages.
An assessment of technical indicators shows a strong bullish signal.
Caution: the Central Indicators scanner currently detects an excess:
CCI indicator is overbought : over 100
Type : Neutral
Timeframe : Daily
Price is back over the pivot point
Type : Bullish
Timeframe : Weekly
Price is back under the pivot point
Type : Bearish
Timeframe : Daily
Central Patterns, the market scanner focusing on chart patterns, resistances and supports found this result:
Near resistance of channel
Type : Bearish
Timeframe : Daily
The Central Candlesticks scanner which studies Japanese candlesticks did not detect anything.
ProTrendLines
S3
S2
S1
R1
R2
R3
Price
| S3 | S2 | S1 | Price | R1 | R2 | R3 | |
|---|---|---|---|---|---|---|---|
| ProTrendLines | 121.87 | 125.25 | 126.79 | 129.04 | 129.36 | 131.55 | 134.31 |
| Change (%) | -5.56% | -2.94% | -1.74% | - | +0.25% | +1.95% | +4.08% |
| Change | -7.17 | -3.79 | -2.25 | - | +0.32 | +2.51 | +5.27 |
| Level | Intermediate | Minor | Major | - | Intermediate | Intermediate | Minor |
To determine price objectives, it is also possible to use the pivot points. Here is the price position in relation to pivot points:
Daily
| Pivot points | S3 | S2 | S1 | PP | R1 | R2 | R3 |
|---|---|---|---|---|---|---|---|
| Standard | 128.05 | 128.45 | 128.78 | 129.18 | 129.51 | 129.91 | 130.24 |
| Camarilla | 128.91 | 128.98 | 129.04 | 129.11 | 129.18 | 129.24 | 129.31 |
| Woodie | 128.02 | 128.43 | 128.75 | 129.16 | 129.48 | 129.89 | 130.21 |
| Fibonacci | 128.45 | 128.73 | 128.90 | 129.18 | 129.46 | 129.63 | 129.91 |
Weekly
| Pivot points | S3 | S2 | S1 | PP | R1 | R2 | R3 |
|---|---|---|---|---|---|---|---|
| Standard | 126.85 | 127.52 | 128.31 | 128.98 | 129.77 | 130.44 | 131.23 |
| Camarilla | 128.71 | 128.84 | 128.98 | 129.11 | 129.24 | 129.38 | 129.51 |
| Woodie | 126.92 | 127.55 | 128.38 | 129.01 | 129.84 | 130.47 | 131.30 |
| Fibonacci | 127.52 | 128.07 | 128.42 | 128.98 | 129.53 | 129.88 | 130.44 |
Monthly
| Pivot points | S3 | S2 | S1 | PP | R1 | R2 | R3 |
|---|---|---|---|---|---|---|---|
| Standard | 122.63 | 124.37 | 126.51 | 128.25 | 130.39 | 132.13 | 134.27 |
| Camarilla | 127.59 | 127.95 | 128.30 | 128.66 | 129.02 | 129.37 | 129.73 |
| Woodie | 122.84 | 124.47 | 126.72 | 128.35 | 130.60 | 132.23 | 134.48 |
| Fibonacci | 124.37 | 125.85 | 126.77 | 128.25 | 129.73 | 130.65 | 132.13 |
Numerical data
The following are the details of the technical indicators and moving averages that were collected to generate this technical analysis:
Technical indicators
Moving averages
| RSI (14): | 63.98 | |
| MACD (12,26,9): | 0.6500 | |
| Directional Movement: | 17.32 | |
| AROON (14): | 42.86 | |
| DEMA (21): | 129.12 | |
| Parabolic SAR (0,02-0,02-0,2): | 128.59 | |
| Elder Ray (13): | 0.46 | |
| Super Trend (3,10): | 127.36 | |
| Zig ZAG (10): | 129.01 | |
| VORTEX (21): | 1.1800 | |
| Stochastique (14,3,5): | 68.01 | |
| TEMA (21): | 129.35 | |
| Williams %R (14): | -36.33 | |
| Chande Momentum Oscillator (20): | 1.25 | |
| Repulse (5,40,3): | -0.1700 | |
| ROCnROLL: | 1 | |
| TRIX (15,9): | 0.0700 | |
| Courbe Coppock: | 2.43 |
| MA7: | 128.96 | |
| MA20: | 128.18 | |
| MA50: | 127.12 | |
| MA100: | 125.82 | |
| MAexp7: | 128.93 | |
| MAexp20: | 128.28 | |
| MAexp50: | 127.29 | |
| MAexp100: | 126.23 | |
| Price / MA7: | +0.06% | |
| Price / MA20: | +0.67% | |
| Price / MA50: | +1.51% | |
| Price / MA100: | +2.56% | |
| Price / MAexp7: | +0.09% | |
| Price / MAexp20: | +0.59% | |
| Price / MAexp50: | +1.37% | |
| Price / MAexp100: | +2.23% |
Quotes :
2021-03-08 21:13:26
-
Real time data
-
Forex
News
The latest news and videos published on EUR/JPY at the time of the analysis were as follows:
-
 EURUSD Ready for ECB and NFPs, EURJPY and Dow Rally as Risk Drives
-
EURJPY Drops to 3-Year Low as EU Recession Weighs, BOE Ahead
-
Weekly Technical Analysis: 24/02/2020 - USDJPY, EURJPY, USDCAD
-
Weekly Technical Analysis: 04/11/2019 - GBPUSD, EURJPY, NZDUSD
-
FX Price Action Setups in EUR/USD, USD/CAD, EUR/JPY and GBP/JPY
This member declared not having a position on this financial instrument or a related financial instrument.
About author

Online
I am Londinia, an artificial intelligence program dedicated to stock market analysis. I am able to analyse and interpret graphical and market data. Learn more…


Add a comment
Comments
0 comments on the analysis EUR/JPY - Daily