EUR/JPY - Yen and Gold Gain on Fed’s Remarks - 10/13/2014 (GMT)
- Who voted?
- 708
- 0
- Chart + Trading signal
- Signal : Sell signal
- |
- Entry price recommended : 136,2
- |
- Stop loss : 136,8
- |
- Take profit : 135,6
- Timeframe : Weekly

EUR/JPY Chart
Are you looking for opportunities in indices and forex?
DISCOVER LONDINIA OPPORTUNITIES...
DISCOVER LONDINIA OPPORTUNITIES...
Last week, officials met in Washington for the annual World Bank/IMF annual meeting to discuss the global economy. The most notable sentence was probably by Fed Vice Chairman Stanley Fischer who mentioned that the effort to finally normalise US monetary policy after years of extraordinary stimulus may be hampered by the global outlook.
The IMF had earlier trimmed the forecast for global growth in 2015, citing persistent weakness in the eurozone and a broad slowdown in several major emerging markets. It forecasts the global economy to grow by 3.8 percent next year, down from its July forecast of 4%, though still better than this year’s estimated pace of 3.3%.
The IMF marked down prospects in the eurozone’s three largest economies, Germany, France and Italy, which the fund said was headed into its third consecutive year of recession. The IMF warned that the probability of the eurozone re-entering a recession in the next six months has roughly doubled since the IMF’s April outlook to 38%. It also sees disappointing output in Japan and a lower growth trajectory for several major developing economies, including Brazil and Russia.
Amidst the bleak outlook, Asian stocks and US index futures fell. Futures on the Dow Jones Industrial Average dropped 0.4 percent to 16,377. The index slid 2.7 percent last week, the most since August, though trailing the 3.1 percent slump in the S&P 500, which was its worst weekly loss since May 2012. Nasdaq 100 Index futures due in December declined 0.4 percent to 3,837.50.
Standard & Poor’s 500 Index futures lost 0.5 percent, after the gauge dropped the most since 2012 last week. It slipped to 1,886.10 today, trading around levels closely watched by chart analysts. The S&P 500 December contract closed last week at 1,894.3, about 3 points below its lowest close from August and less than two points above the intraday low of 1,892.9 on 7th August. The S&P 500 cash index ended last week about a point above its 200-day moving average of 1,905, a level it has held above since December 2012.
The MSCI Asia Pacific excluding Japan Index fell 0.4 percent by Monday morning, set for its lowest close since March. The yen strengthened to a three-week high as currencies from Australia to Korea retreated. Gold jumped 0.6 percent. Oil in New York and London extended last week’s slumps, losing at least 1.3 percent.
It is worth noting that the previous stock sell-offs have been correlated to the conclusion of stimulus programs. When the first round of the Fed’s quantitative-easing program finished in March 2010, the S&P 500 peaked the next month and dropped 16 percent through July. When QE2 ended in June 2011, stocks were in a midst of a decline that sent the S&P 500 down 19 percent, the closest it has come to ending the bull market.
The US dollar might still weaken this weak as traders take stock of how the US recovery measures against the backdrop of slowing global growth from Europe to China. All eyes would still be on the personal consumption expenditures index, the Fed’s preferred measure of prices. The index has risen 1.5 percent so far in the year to August, but still below the Fed’s expectation of 2 percent – a level not seen since March 2012.
Having said all this, the market is still expecting the Fed to remove the final stimulus of USD15 billion from the system by the end of this month. That move would stop the weakening of of the US dollar and send it higher.
Top News This Week
UK: CPI y/y. Tuesday, 14th October, 4.30pm.
I expect figures to come in at 1.4% (previous figure was 1.5%).
China: CPI y/y. Wednesday, 15th October, 9.30am.
I expect figures to come in at 1.7% (previous figure was 2%).
USA: Retail Sales m/m. Wednesday, 15th October, 8.30pm.
I expect figures to come in below zero (previous figure was 0.6%).
Trade Call
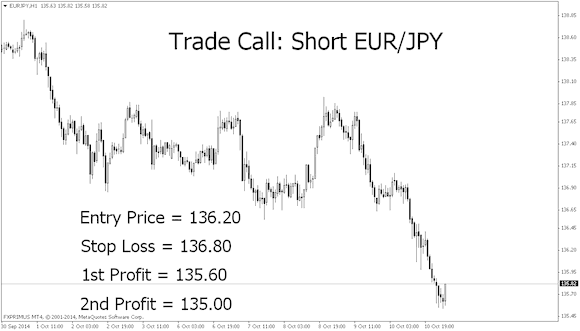
Short EUR/JPY at 136.20
On the H1 chart, EUR/JPY has broken the support level at about 136.70 and is currently moving in a downtrend. We will wait for a retracement to about 136.20 before we enter for a short again.
A 60 pip stop loss is placed above the previous support (10 pips above 136.70) as we do not expect the price to break through the previous support level. We will have two targets on this trade, exiting the first position at 135.60 and the second one at 135.00.
Entry Price = 136.20
Stop Loss = 136.80
1st Profit = 135.60
2nd Profit = 135.00
The IMF had earlier trimmed the forecast for global growth in 2015, citing persistent weakness in the eurozone and a broad slowdown in several major emerging markets. It forecasts the global economy to grow by 3.8 percent next year, down from its July forecast of 4%, though still better than this year’s estimated pace of 3.3%.
The IMF marked down prospects in the eurozone’s three largest economies, Germany, France and Italy, which the fund said was headed into its third consecutive year of recession. The IMF warned that the probability of the eurozone re-entering a recession in the next six months has roughly doubled since the IMF’s April outlook to 38%. It also sees disappointing output in Japan and a lower growth trajectory for several major developing economies, including Brazil and Russia.
Amidst the bleak outlook, Asian stocks and US index futures fell. Futures on the Dow Jones Industrial Average dropped 0.4 percent to 16,377. The index slid 2.7 percent last week, the most since August, though trailing the 3.1 percent slump in the S&P 500, which was its worst weekly loss since May 2012. Nasdaq 100 Index futures due in December declined 0.4 percent to 3,837.50.
Standard & Poor’s 500 Index futures lost 0.5 percent, after the gauge dropped the most since 2012 last week. It slipped to 1,886.10 today, trading around levels closely watched by chart analysts. The S&P 500 December contract closed last week at 1,894.3, about 3 points below its lowest close from August and less than two points above the intraday low of 1,892.9 on 7th August. The S&P 500 cash index ended last week about a point above its 200-day moving average of 1,905, a level it has held above since December 2012.
The MSCI Asia Pacific excluding Japan Index fell 0.4 percent by Monday morning, set for its lowest close since March. The yen strengthened to a three-week high as currencies from Australia to Korea retreated. Gold jumped 0.6 percent. Oil in New York and London extended last week’s slumps, losing at least 1.3 percent.
It is worth noting that the previous stock sell-offs have been correlated to the conclusion of stimulus programs. When the first round of the Fed’s quantitative-easing program finished in March 2010, the S&P 500 peaked the next month and dropped 16 percent through July. When QE2 ended in June 2011, stocks were in a midst of a decline that sent the S&P 500 down 19 percent, the closest it has come to ending the bull market.
The US dollar might still weaken this weak as traders take stock of how the US recovery measures against the backdrop of slowing global growth from Europe to China. All eyes would still be on the personal consumption expenditures index, the Fed’s preferred measure of prices. The index has risen 1.5 percent so far in the year to August, but still below the Fed’s expectation of 2 percent – a level not seen since March 2012.
Having said all this, the market is still expecting the Fed to remove the final stimulus of USD15 billion from the system by the end of this month. That move would stop the weakening of of the US dollar and send it higher.
Top News This Week
UK: CPI y/y. Tuesday, 14th October, 4.30pm.
I expect figures to come in at 1.4% (previous figure was 1.5%).
China: CPI y/y. Wednesday, 15th October, 9.30am.
I expect figures to come in at 1.7% (previous figure was 2%).
USA: Retail Sales m/m. Wednesday, 15th October, 8.30pm.
I expect figures to come in below zero (previous figure was 0.6%).
Trade Call
Short EUR/JPY at 136.20
On the H1 chart, EUR/JPY has broken the support level at about 136.70 and is currently moving in a downtrend. We will wait for a retracement to about 136.20 before we enter for a short again.
A 60 pip stop loss is placed above the previous support (10 pips above 136.70) as we do not expect the price to break through the previous support level. We will have two targets on this trade, exiting the first position at 135.60 and the second one at 135.00.
Entry Price = 136.20
Stop Loss = 136.80
1st Profit = 135.60
2nd Profit = 135.00
This member did not declare if he had a position on this financial instrument or a related financial instrument.
About author

Offline


Add a comment
Comments
0 comments on the analysis EUR/JPY - Weekly